HANDBOOK ON BATTERY
ENERGY STORAGE SYSTEM
DECEMBER 2018
ASIAN DEVELOPMENT BANK

ASIAN DEVELOPMENT BANK
ASIAN DEVELOPMENT BANK
HANDBOOK ON BATTERY
ENERGY STORAGE SYSTEM
DECEMBER

Creative Commons Attribution 3.0 IGO license (CC BY 3.0 IGO)
© 2018 Asian Development Bank
6 ADB Avenue, Mandaluyong City, 1550 Metro Manila, Philippines
Tel +63 2 632 4444; Fax +63 2 636 2444
www.adb.org
Some rights reserved. Published in .
ISBN ---- (print), ---- (electronic)
Publication Stock No. TCS-
DOI: http://dx.doi.org/10.22617/TCS189791-2
The views expressed in this publication are those of the authors and do not necessarily reflect the views and policies
ofthe Asian Development Bank (ADB) or its Board of Governors or the governments they represent.
ADB does not guarantee the accuracy of the data included in this publication and accepts no responsibility for any
consequence of their use. The mention of specific companies or products of manufacturers does not imply that they
are endorsed or recommended by ADB in preference to others of a similar nature that are not mentioned.
By making any designation of or reference to a particular territory or geographic area, or by using the term “country”
inthis document, ADB does not intend to make any judgments as to the legal or other status of any territory or area.
This work is available under the Creative Commons Attribution 3.0 IGO license (CC BY 3.0 IGO)
https://creativecommons.org/licenses/by/3.0/igo/. By using the content of this publication, you agree to be bound
bytheterms of this license. For attribution, translations, adaptations, and permissions, please read the provisions
andterms of use at https://www.adb.org/terms-use#openaccess.
This CC license does not apply to non-ADB copyright materials in this publication. If the material is attributed
toanother source, please contact the copyright owner or publisher of that source for permission to reproduce it.
ADB cannot be held liable for any claims that arise as a result of your use of the material.
Please contact pubsmarketing@adb.org if you have questions or comments with respect to content, or if you wish
toobtain copyright permission for your intended use that does not fall within these terms, or for permission to use
theADB logo.
Notes:
In this publication, “$” refers to United States dollars.
ADB recognizes “Korea” as the Republic of Korea.
On the cover: ADB Solar Mini Grid Pilot Project in Harkapur, Okhaldhunga, Nepal (Photo by C. Lao Torregosa);
and, ADB solar-wind hybrid project site in Pira Kalwal and Wadgal Village, Joharabad, Khushab District, Pakistan
(Photo by Nasr ur Rahman)
Corrigenda to ADB publications may be found at http://www.adb.org/publications/corrigenda.

iii
Table and Figures vi
Foreword ix
Acknowledgments x
Abbreviations xi
Executive Summary xiii
Energy Storage Technologies
. Storage Types
. Components of a Battery Energy Storage System (BESS)
.. Energy Storage System Components
.. Grid Connection for Utility-Scale BESS Projects
. Battery Chemistry Types
.. Lead–Acid (PbA) Battery
.. Nickel–Cadmium (Ni–Cd) Battery
.. Nickel–Metal Hydride (Ni–MH) Battery
.. Lithium-Ion (Li-Ion) Battery
.. Sodium–Sulfur (Na–S) Battery
.. Redox Flow Battery (RFB)
Business Models for Energy Storage Services
. Ownership Models
.. Third-Party Ownership
.. Outright Purchase and Full Ownership
.. Electric Cooperative Approach to Energy Storage Procurement
. Factors Aecting the Viability of BESS Projects
. Financial and Economic Analysis
.. Criteria for the Economic Analysis of BESS Projects
.. Key Assumptions in the Cost–Benefit Analysis of BESS Projects
Grid Applications of Battery Energy Storage Systems
CONTENTS

iv
CONTENTS
. Scoping of BESS Use Cases
. General Grid Applications of BESS
. Technical Requirements
.. Round-TripEciency
.. ResponseTime
.. LifetimeandCycling
.. Sizing
. Operation and Maintenance
. Use Cases
.. Frequency Regulation
.. Renewable Energy Integration
.. Peak Shaving and Load Leveling
. Microgrids
Challenges and Risks
. General Challenges
.. Cost Reduction
.. Deployment
.. Incentive Program
.. United Nations Framework Convention on Climate Change
. General Risks
.. Poorly Defined and Categorized Systems
.. Unbundling of Operation and Network Development Activities
.. Grid Tari Applications and Licensing Issues
.. Battery Safety
. Challenges of Reducing Carbon Emissions
. Battery Recycling and Reuse Risks
.. Examples of Battery Reuse and Recycling
.. Reuse of Electric Vehicle Batteries for Energy Storage
.. Recycling Process
Policy Recommendations
. Frequency Regulation
. Renewable Integration

CONTENTS
v
.. Distribution Grids
.. Transmission Grids
. Peak Shaving and Load Leveling
. Microgrids
Appendixes
A Sample Financial and Economic Analysis
B Case Study of a Wind Power plus Energy Storage System Project in the
Republic of Korea
C Modeling and Simulation Tools for Analysis of Battery Energy Storage System Projects
D Battery Energy Storage System Implementation Examples
E Battery Chemistry
F Comparison of Technical Characteristics of Energy Storage System Applications
G Summary of Grid Storage Technology Comparison Metrics

vi
Tables
. Discharge Time and Energy-to-Power Ratio of Dierent Battery Technologies
. Advantages and Disadvantages of Lead–Acid Batteries
. Types of Lead-Acid Batteries
. Uses of Lead–Acid Batteries
. Advantages and Disadvantages of Nickel–Cadmium Batteries
. Advantages and Disadvantages of Nickel–Metal Hydride Batteries
. Advantages and Disadvantages of Lithium-Ion Batteries
. Types of Lithium-Ion Batteries
. Advantages and Disadvantages of Sodium–Sulfur Batteries
. Advantages and Disadvantages of Redox Flow Batteries
. Types of Vanadium Redox Batteries
. Energy Storage Ownership Models
. Key Factors Aecting the Viability of Battery Energy Storage System Projects
. Comparison of Dierent Lithium-Ion Battery Chemistries
. Energy Storage Use Case Applications, by Stakeholder
. Technical Considerations for Grid Applications of Battery Energy Storage Systems
. Sizing Methods for Power and Energy Applications
. Operation and Maintenance of Battery Energy Storage Systems
. Energy Storage Services and Emission Reduction
A. Underlying Assumptions
A. Capital Expenditure
A. Operating Expenditure
A. Revenue
A. Financial Internal Rate of Return
A. Calculation of Financial internal Rate of Return
A. Calculation of Financial internal Rate of Return (University of Minnesota Energy
Transition Lab, Strategen Consulting, and Vibrant Clean Energy )
B. Major Premises and Assumptions for Simple Levelized Cost of Electricity Estimations
of Wind Power
B. Comparison of Levelized Cost of Electricity for Wind Power Generation at Various Energy
Storage System Operating Rates
C. Available Modeling Tools
D. Sokcho Substation, Republic of Korea - BESS Equipment Specifications
D. Other Examples of BESS Application in Renewable Energy Integration
TABLES AND FIGURES

TABLES AND FIGURES
vii
Figures
. Classification of Storage Technologies, by Energy Type
. Dierent Technologies for Dierent Purposes
. Comparison of Power Output (in watts) and Energy Consumption (in watt-hours) for Various
Energy Storage Technologies
. Dierentiating Characteristics of Dierent Battery Technologies
. Present and Future Battery Technologies
. Grid Storage Needs along the Value Chain
. Schematic of a Battery Energy Storage System
. Schematic of a Utility-Scale Energy Storage System
. Grid Connections of Utility-Scale Battery Energy Storage Systems
. Stackable Value Streams for Battery Energy Storage System Projects
. ADB Economic Analysis Framework
. Expected Drop in Lithium-Ion Cell Prices over the Next Few Years (/kWh)
. Breakdown of Battery Cost, –
. Benchmark Capital Costs for a MW/ MWh Utility-Sale Energy Storage System Project
(Real /kWh)
. Benchmark Capital Costs for a kW/ kWh Residential Energy Storage System Project
(Real /kWh)
. Lifetime Curve of Lithium–Iron–Phosphate Batteries
. Battery Energy Storage System Deployment across the Electrical Power System
. Frequency Containment and Subsequent Restoration
. Suitability of Batteries for Short Bursts of Power
. Rise in Solar Energy Variance on Cloudy Days
. Solar Photovoltaic installation with a Storage System
. Illustration of Variability of Wind-Power Generation
. Use of Energy Storage Systems for Peak Shaving
. Use of Energy Storage Systems for Load Leveling
. Microgrid on Jeju Island, Republic of Korea
. Price Outlook for Various Energy Storage Systems and Technologies
. Magnified Photos of Fires in Cells, Cell Strings, Modules, and Energy Storage Systems
. Second-Life Process for Electric Vehicle Batteries
. GMABB Second-Life Electric Vehicle Battery Applications
. Second-Life Energy Storage Application for BMW Electric Vehicle Batteries
. BMW–Bosch Second-Life Electric Vehicle Battery Demonstration Project
. Renault–Powervault’s Second-Life Electric Vehicle Battery Application
. Nissan–Sumitomo Electric Vehicle Battery Reuse Application (R Energy)
. Reuse of Electric Vehicle Batteries in Energy Storage Systems
. Second-Life Electric Vehicle Battery Applications
. Lithium-Ion Battery Recycling Process
. Chemical Recycling of Lithium Batteries, and the Resulting Materials
. Physical Recycling of Lithium Batteries, and the Resulting Materials

viii
TABLES AND FIGURES
D. Sokcho Single Line Diagram
D. Sokcho Site Plan
D. Bird’s Eye View of Sokcho Battery Energy Storage System
D. Sokcho Battery Energy Storage System
D. BESS Application in Renewable Energy Integration
D. MW Yeongam Solar Photovoltaic Park, Republic of Korea
D. Peak Shaving at Douzone Oce Building, Republic of Korea
D. Douzone Oce Building System Diagram and CCTV Screen Capture
D. Graphical Illustration of Peak Shaving at Duozone Oce Building
D. Black Start Capability
D. First Microgrid System on Gapa Island
D. Sendai Microgrid Project
D. System Configuration of Microgrid on Gapa Island
E. Lead-Acid Battery Schematic and Physical Structure
E. Chemical and Physical Structures of Nickel-Cadmium Battery
E. Chemical and Physical Structures of Nickel-Metal Hydride Battery
E. Physical and Chemical Structures of Lithium-Ion Battery
E. Chemical and Physical Structures of Sodium-Sulfur Battery
E. Schematic of Redox Flow Battery
E. Physical Structure of Redox Flow Battery

ix
FOREWORD
This Handbook on Battery Energy Storage Systems is part of a series of reference materials on advanced
technologies. The objectives of this series are to support the Asian Development Bank (ADB)
operations in adopting and deploying advanced technologies in energy projects for its developing
member countries, scale up the ADB Clean Energy Program, and bring the energy sector closer to
achieving its targets in climate finance.
This handbook outlines the various battery energy storage technologies, their application, and the
caveats to consider in their development. It discusses the economic as well financial aspects of battery
energy storage system projects, and provides examples from around the world. The handbook also lays
down the policy requirements that will allow battery energy storage system development to thrive.
Energy-related carbon dioxide emissions increased by . in to a historic high of . gigatons of
carbon dioxide—with the power sector accounting for almost two-thirds of the growth in emissions.
Additional capacity from renewables on the other hand, declined in after decades of sustained
growth. These do not bode well and call for bigger and bolder eorts to fight climate change. We
need to grab every opportunity to innovate and apply the most eective intervention at the quickest
possible time.
As this handbook will show, battery energy storage systems fulfill objectives that generate multiple
benefits: integration of variable renewables, improvement in energy eciency, reliability of electricity
supply, and access to and security of energy. Battery energy storage systems have a critical role in
transforming energy systems that will be clean, ecient, and sustainable. May this handbook serve as a
helpful reference for ADB operations and its developing member countries as we collectively face the
daunting task at hand.
Yongping Zhai
Chief of Energy Sector Group
Sustainable Development and Climate Change Department
Asian Development Bank

x
ACKNOWLEDGMENTS
The Handbook on Battery Energy Storage System is an output of a comprehensive study carried out
by the Sustainable Development and Climate Change Department of the Asian Development Bank
(ADB) under Promoting Sustainable Energy for All in Asia and the Pacific – Renewable Energy
Minigrids and Distributed Power Generation (Subproject A). The study was conducted by a team in
the Sector Advisory Service Cluster–Energy Sector Group (SDSC-ENE) led by Dae Kyeong Kim, Senior
Energy Specialist (Smart Grids), under the overall guidance of Robert Guild, Chief Sector Ocer, and
Yongping Zhai, Chief of the Energy Sector Group. Two international experts were also part of the team
and made invaluable contributions in their capacities as authors of background papers.
This handbook was written by: Dae Kyeong Kim, Senior Energy Specialist (Smart Grids), SDCC;
Susumu Yoneoka, Energy Specialist (Smart Grids), SDCC; Ali Zain Banatwala (Consultant); and Yu-
Tack Kim (Consultant). Kee-Yung Nam, Principal Energy Economist, SDCC, reviewed the publication
structure. Charity L. Torregosa, senior energy ocer, coordinated the production and worked with
Mary Ann Asico (editor), Edith Creus (cover designer and lay-out artist), Jess Macasaet (proofreader),
Cynthia A. Hidalgo and April-Marie D. Gallega from the Department of Communications. Sta
support was also provided by Ana Maria Tolentino, Angelica Apilado, and Maria Dona Aliboso.
The authors would like to extend their gratitude to other colleagues who provided comments, inputs,
insights from operations, namely: Andrew Jeries, James Kolantharaj, and Tianhua Luo.

xi
ABBREVIATIONS
AC – alternating current
ACB – air circuit breaker
BESS – battery energy storage system
BMS – battery management system
CAES – compressed air energy storage
CB – circuit breaker
C&I – commercial and industrial
COD – commercial operation date
DLC – double-layer capacitor
EFR – enhanced frequency response
EIS – electric insulation switchgear
EMS – energy management system
EPC – engineering, procurement, and construction
ESCO – energy service company
ESS – energy storage system
EV – electric vehicle
FES – flywheel energy storage
GIS – gas insulation switchgear
HSCB – high-speed circuit breaker
IGBT – insulated gate bipolar transistors

xii
ABBREVIATIONS
IPP – independent power producer
kW – kilowatt
kWh – kilowatt–hour
LA – lead–acid
LCOS – levelized cost of energy storage
LFP – lithium–iron–phosphate
LMO – lithium–manganese oxide
LPMS – local power management system
LSE – load-serving entity
LTO – lithium–titanate
MW – megawatt
NCA – nickel–cobalt–aluminum oxide
PCC – point of common coupling
PCS – power conversion system
PMS – power management system
PV – photovoltaic
SCS – supervisory control system
SOC – state of charge
SOH – state of heath
UPS – uninterruptible power supply
VRFB – vanadium redox flow battery
VRLA – valve-regulated lead–acid
W – watt
ZBFB – zinc–bromine flow battery

xiii
EXECUTIVE SUMMARY
This handbook serves as a guide to the applications, technologies, business models, and regulations that
should be considered when evaluating the feasibility of a battery energy storage system (BESS) project.
Several applications and use cases, including frequency regulation, renewable integration, peak shaving,
microgrids, and black start capability, are explored. For example, the integration of distributed energy
resources into traditional unidirectional electric power systems is challenging because of the increased
complexity of maintaining system reliability despite the variable and intermittent nature of wind and solar
power generation, or keeping customer taris aordable while investing in network expansion, advanced
metering infrastructure, and other smart grid technologies.
The key to overcoming such challenges is to increase power system flexibility so that the occasional
periods of excessive renewable power generation need not be curtailed or so that there is less need for
large investments in network expansion that lead to high consumer prices. Storage oers one possible
source of flexibility.
Batteries have already proven to be a commercially viable energy storage technology. BESSs are modular
systems that can be deployed in standard shipping containers. Until recently, high costs and low round
trip eciencies prevented the mass deployment of battery energy storage systems. However, increased
use of lithium-ion batteries in consumer electronics and electric vehicles has led to an expansion in global
manufacturing capacity, resulting in a significant cost decrease that is expected to continue over the next
few years. The low cost and high eciency of lithium-ion batteries has been instrumental in a wave of
BESS deployments in recent years for both small-scale, behind-the-meter installations and large-scale,
grid-level deployments. This handbook breaks down the BESS into its critical components and provides a
basis for estimating the costs of future BESS projects.
For example, battery energy storage systems can be used to overcome several challenges related to
large-scale grid integration of renewables. First, batteries are technically better suited to frequency
regulation than the traditional spinning reserve from power plants. Second, batteries provide a cost-
eective alternative to network expansion for reducing curtailment of wind and solar power generation.
Similarly, batteries enable consumer peak charge avoidance by supplying o-grid energy during on-grid
peak consumption hours. Third, as renewable power generation often does not coincide with electricity
demand, surplus power should be either curtailed or exported. Surplus power can instead be stored in
batteries for consumption later when renewable power generation is low and electricity demand increases.
The financial viability of a BESS project for renewable integration will depend on the cost–benefit analysis
of the intended application.
The business case for battery energy storage diers by application and by use case. “Prosumers”
(producers–consumers) can calculate the payback period of a home energy storage system from the
spread between the cost of producing and storing rooftop solar power and the cost of purchasing
electricity from the local utility. Industrial consumers and distribution network owners benefit from a

xiv
EXECUTIVE SUMMARY
reduction in peak capacity charges and network expansion deferral because of peak shaving and load
leveling. The business case for using batteries for frequency regulation depends on revenue forecasts
and competition for ancillary services.
Various business models are possible, depending on how ownership and operations responsibility
is divided between utility customers or prosumers and the utility or network operator. For example,
while the charge and discharge cycles of home energy storage systems are set by the home owners
themselves, industrial battery systems could be operated by a demand-side management provider or
flexibility aggregator. Similarly, while large-scale batteries used for frequency regulation may be owned
by private investors, the operation of such systems is likely to be the responsibility of the transmission
system operator as part of the pool of assets that provide spinning reserve.
This handbook lists the major policy and regulatory changes that could help promote energy storage
markets and projects. For example, in most countries that operate ancillary service markets, frequency
regulation products have historically been designed with the technical limitations of large power
stations in mind. However, in , a new ancillary service known as “enhanced frequency response,”
with a sub-second response time that could be met only with the help of batteries, was launched in
Europe. Similarly, in some countries, the provision of frequency regulation is mandatory for developers
of large wind farms, to reduce the need for increased spinning reserve from conventional power plants.
As with most projects, it is important to capture the risks and challenges in undertaking a typical
battery energy storage project. This handbook outlines the most important risks and challenges from a
project execution perspective. It also provides a guide for building a financial model for BESS projects,
including popular investment metrics such as the levelized cost of storage.
This chapter provides an overview of commonly used energy storage technologies. It looks into various
factors that dierentiate storage technologies, such as cost, cycle life, energy density, eciency, power
output, and discharge duration.
One energy storage technology in particular, the battery energy storage system (BESS), is studied in
greater detail together with the various components required for grid-scale operation. The advantages
and disadvantages of dierent commercially mature battery chemistries are examined. The chapter
ends with a review of best practice for recycling and reuse lithium-ion batteries.
. STORAGE TYPES
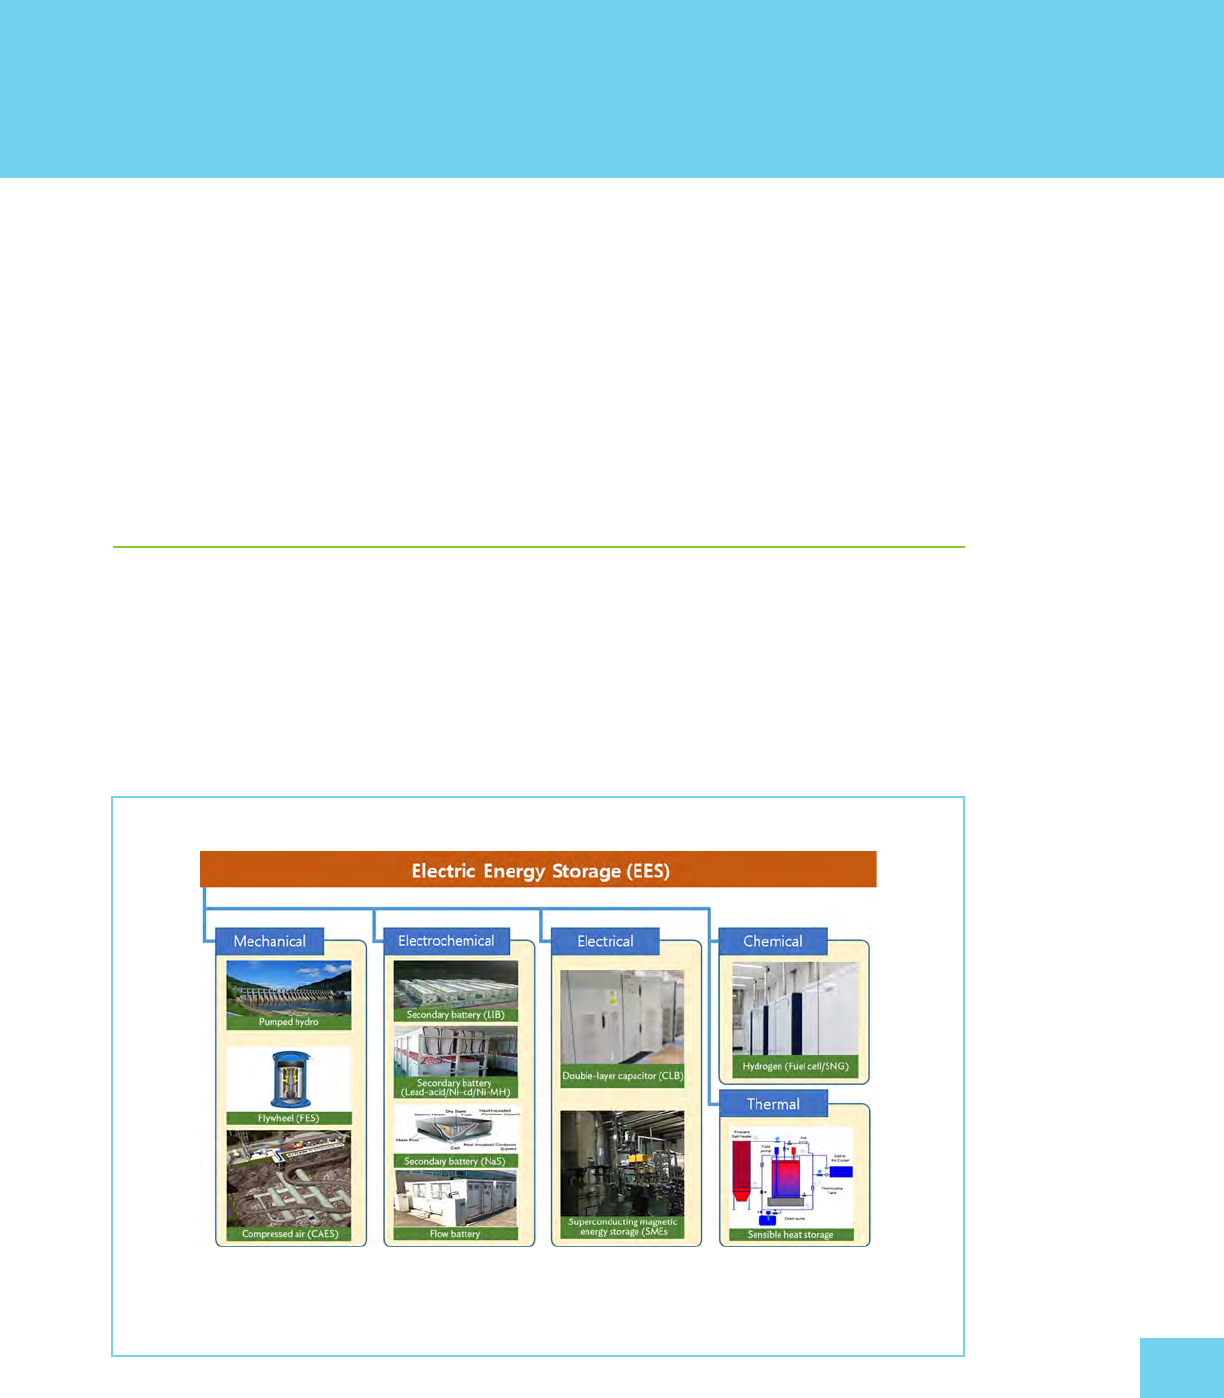
Energy storage devices can be categorized as mechanical, electrochemical, chemical, electrical, or
thermal devices, depending on the storage technology used (Figure .). Mechanical technology,
including pumped hydropower generation, is the oldest technology. However, a limitation of this
technology is its need for abundant water resources and a dierent geographic elevation, as well
as the construction of power transmission lines to households that consume electricity. Recently,
transmission-line construction cost has surpassed the cost of installing a pumped hydropower
generation facility.
ENERGY STORAGE TECHNOLOGIES
Figure .: Classification of Storage Technologies, By Energy Type
*Mechanical, electrochemical, chemical, electrical, or thermal.
Li-ion lithium-ion, Na–S sodium–sulfur, Ni–CD nickel–cadmium, Ni–MH nickel–metal hydride, SMESsuperconducting
magnetic energy storage.
Source: Korea Battery Industry Association “Energy storage system technology and business model”.
2
HANDBOOK ON BATTERY ENERGY STORAGE SYSTEM
In addition to the recent spread of mobile information technology (IT) devices and electric vehicles,
the increased mass production of lithium secondary batteries and their lowered costs have boosted
demand for energy storage devices using such batteries. Lithium secondary batteries convert electric
energy to chemical energy, and vice versa, using electrochemical technologies. Such technologies also
include lead storage batteries and sodium–sulfur batteries. Chemical technologies include energy
storage technologies such as fuel cells, and mechanical technologies include electric double-layer
capacitors.
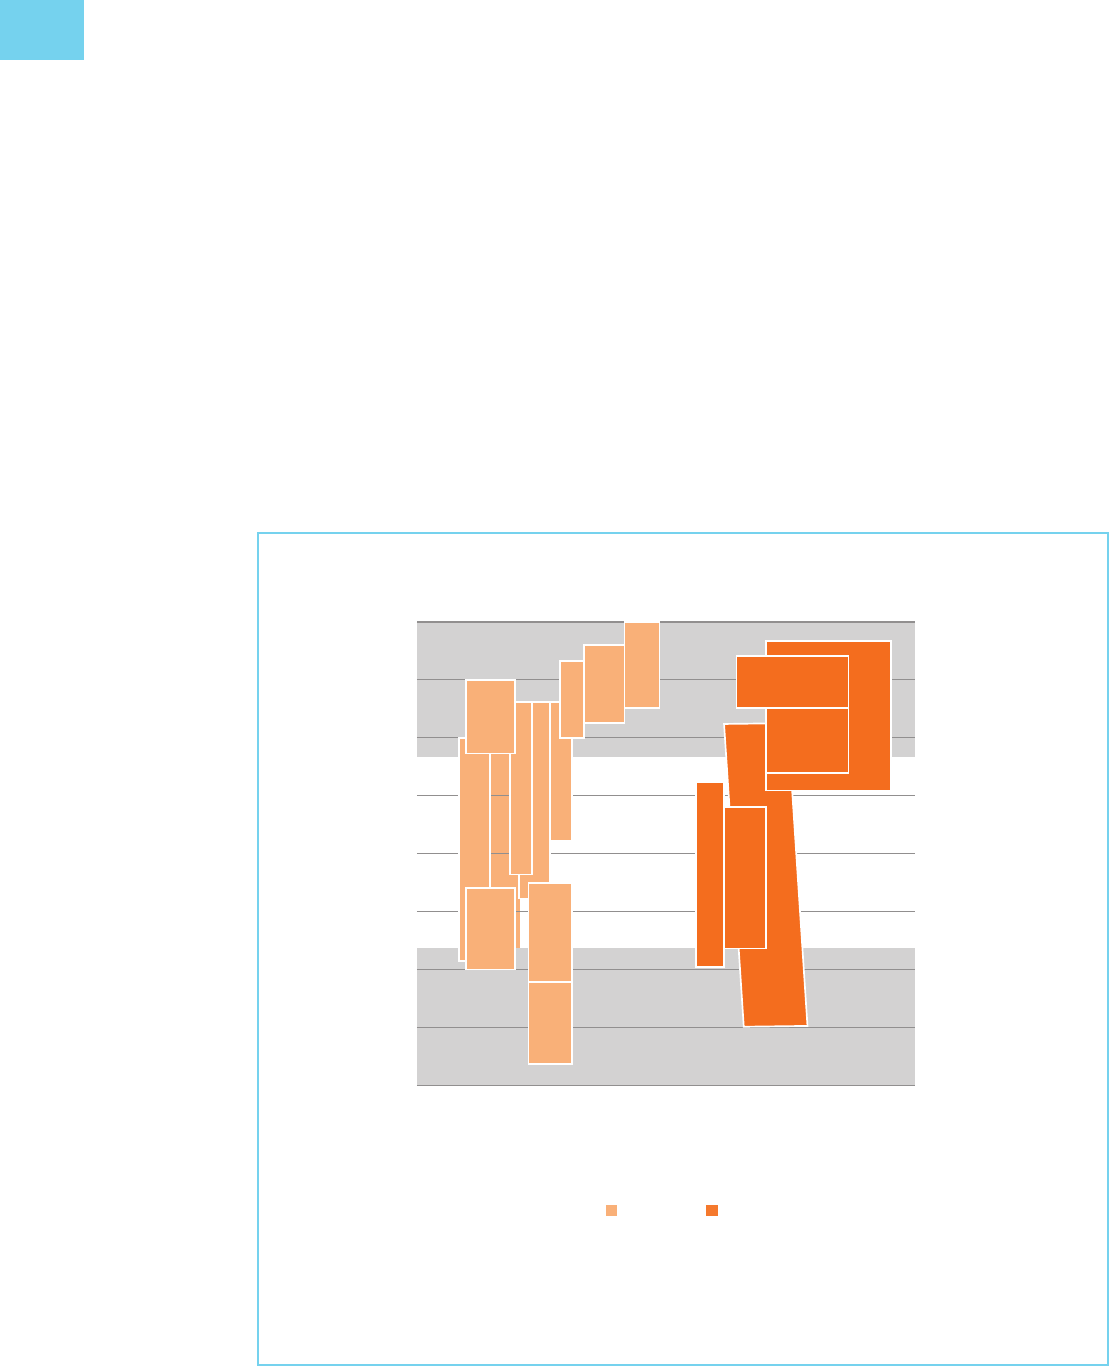
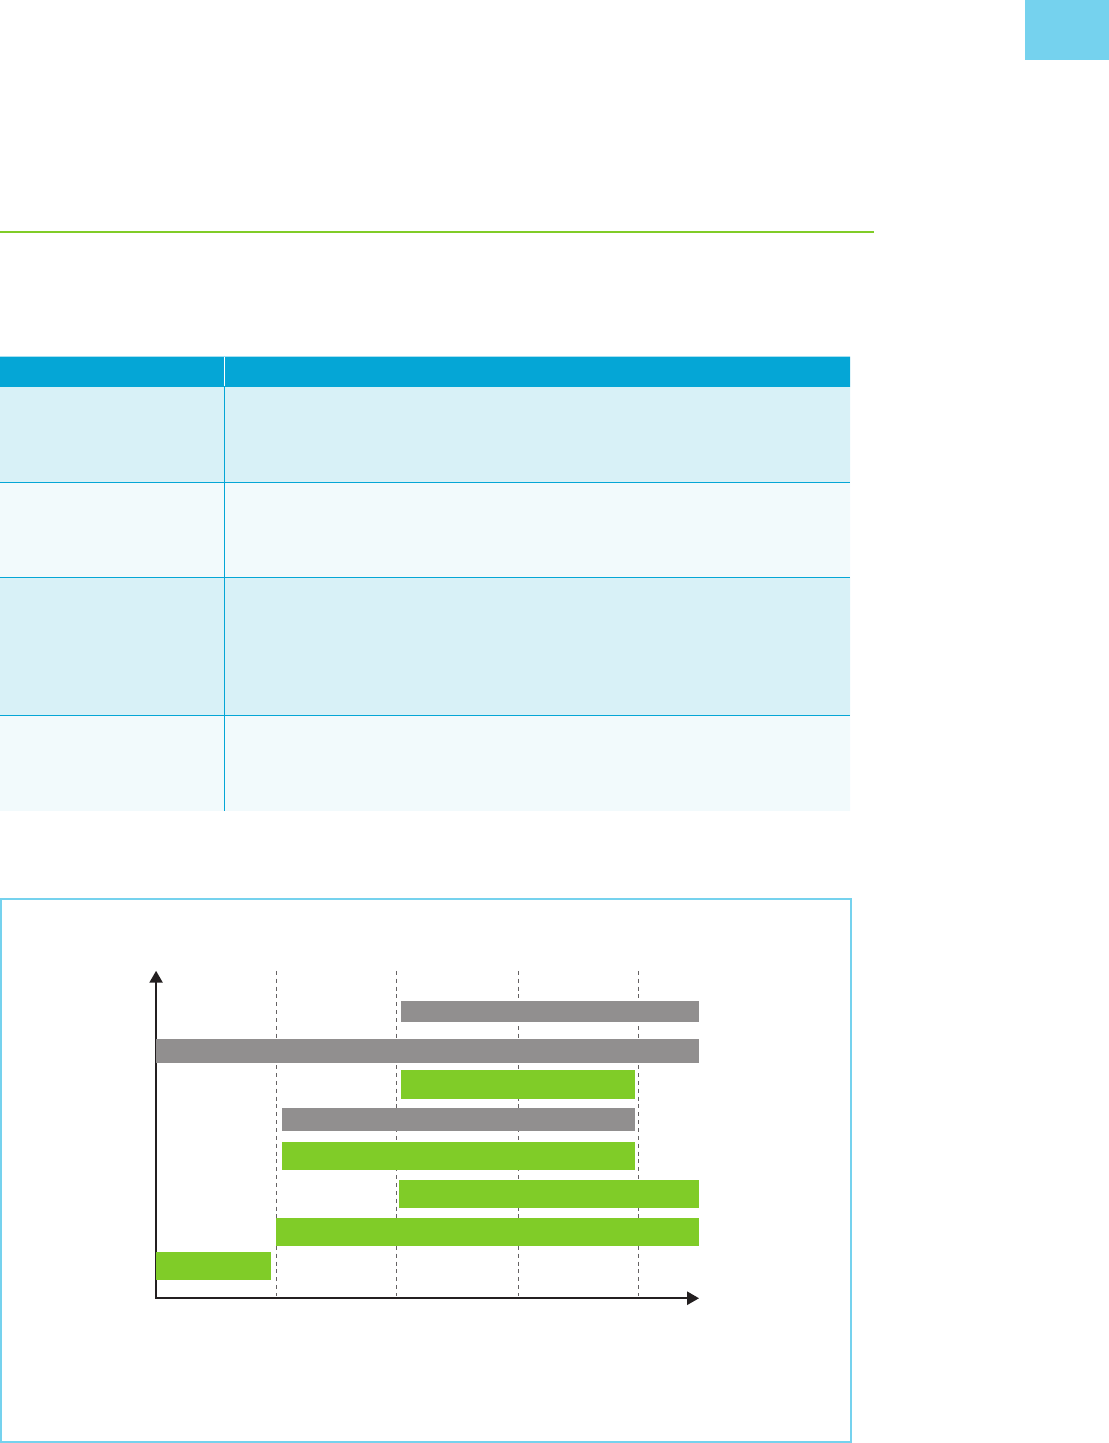
The performance of energy storage devices can be defined by their output and energy density.
Their use can be dierentiated by place and duration of use, as defined by the technology adopted.
In Figure1.2, the applications (in the tan-colored boxes) are classified according to output, usage
period, and power requirement, and the energy storage devices (in the amber-colored boxes)
according to usage period, power generation, and system and/or network operation.
Figure 1.2: Dierent Technologies for Dierent Purposes
Power requirement
10 GW
1 GW
100 MW
10 MW
1 MW
100 kW
10 kW
1 kW
0 kW
Discharge duration
End user
System/network
operator
Generation
SS
1)
wind
PV: grid
support
O-
scale
utility
scale
O-
scale/
end-
user
self-
cons.
Supercapacitors
Voltage regulation
Frequency regulation
Black start
Load following
T&D deferral
Flywheels
Batteries
Micro-second
Second
Minute
Hour
Day
Week
Season
Micro-second
Second
Minute
Hour
Day
Week
Season
1) Small-scale 2) Large-scale 3) Power-to-gas Applications Technology
Arbitrage
Inter-seasonal
storage
Seasonal
storage
Pumped hydro
storage (PHS)
Compressed air
energy storage
(CAES)
P2G
3)
LS
2)
wind
PV: grid
support
GW = gigawatt, kW = kilowatt, MW = megawatt, P2G = power to gas, PV = photovoltaic, SS = small-scale, T&D = transmission
and distribution.
Source: ROLAND BERGER GMBH (2017). R. Berger, “Business models in energy storage – Energy Storage can bring utilities back
into the game,” May.

ENERGY STORAGE TECHNOLOGIES
Figure .: Comparison of Power Output (in watts) and Energy Consumption (in watt-hours)
for Various Energy Storage Technologies
UPS
Power Quality
Bulk Power
Management
Flow Battery
Zn-Cl, Zn-Br, V
Advanced Lead-Acid Battery
Lead-Acid Battery
Lithium Battery
Supercapacitor
Supercapacitor (Power)
Flywheel
1kW 10kW
Seconds Minutes Hours
100kW 1MW
System Power Ratings, Module Size
Discharge Time at Rated Power
10MW 100MW 1GW
T&D Supporting
and Load Shifting
NaS Battery
GW gigawatt, kW kilowatt, MW megawatt, T&D transmission and distribution, UPS uninterruptible power supply,
V vanadium, Zn–Br zinc–bromine, Zn–Cl zinc–chlorine.
Note: With nominal discharge time ranging from seconds to hours. Both power output and energy consumption are expressed in
logarithmic scales.
Source: Korea Battery Industry Association “Energy storage system technology and business model”.
Energy storage devices can be used for uninterruptible power supply (UPS), transmission and
distribution (T&D) system support, or large-scale generation, depending on the technology applied
and on storage capacity. Among electrochemical, chemical, and physical energy storage devices, the
technologies that have received the most attention recently fall within the scope of UPS and T&D
system support (Figure.). Representative technologies include reduction–oxidation (redox) flow,
sodium–sulfur (Na–S), lead–acid and advanced lead–acid, super-capacitor, lithium, and flywheel
batteries. Lithium batteries are in common use today.
Battery technologies for energy storage devices can be dierentiated on the basis of energy density,
charge and discharge (round trip) eciency, life span, and eco-friendliness of the devices (Figure .).
Energy density is defined as the amount of energy that can be stored in a single system per unit volume
or per unit weight. Lithium secondary batteries store – watt-hours per kilogram (kg) and can
store .– times more energy than Na–S batteries, two to three times more than redox flow batteries,
and about five times more than lead storage batteries.
Charge and discharge eciency is a performance scale that can be used to assess battery eciency.
Lithium secondary batteries have the highest charge and discharge eciency, at , while lead
storage batteries are at about –, and redox flow batteries, at about –.
HANDBOOK ON BATTERY ENERGY STORAGE SYSTEM
One important performance element of energy storage devices is their life span, and this factor has the
biggest impact in reviewing economic eciency. Another major consideration is eco-friendliness, or
the extent to which the devices are environmentally harmless and recyclable.
Figure .: Dierentiating Characteristics of Dierent Battery Technologies
Energy density
(kW/kg)
(150–250)
(125–150) (75–85)
(10–15)
(10–15)
95
1st 1st 1st
2nd 2nd
3rd
X
X
X
X
(60–80) (70–75) (20–25)
2nd 2nd
3rd
(40–60) (60–80) (5–10)
4th
4th
4th
(30–50) (60–70) (3–6)
5th5th5th
Round Trip
Efficiency (%)
Life Span
(years)
Eco-friendliness
Eco-friendliness
Li-ion
NaS
Flow
Lead Acid
Ni-Cd
Li-ion lithium-ion, Na–S sodium–sulfur, Ni–Cd nickel–cadmium.
Source: Korea Battery Industry Association “Energy storage system technology and business model”.
Technological changes in batteries are progressing toward higher energy density (Figure .). Next-
generation battery technologies—lithium-ion, zinc–air, lithium–sulfur, lithium–air, etc.—are expected
to improve on the energy density of lithium secondary (rechargeable) batteries, and be priced below
per kilowatt (kW).
Energy storage device applications vary depending on the time needed to connect to the generator,
transmitter, and place of use of energy, and on energy use. Black start, a technology for restarting
generators after blackouts without relying on the external power grid, is installed in the generating
bus and supplies energy within – minutes. Power supply for maintaining frequency is provided
within a quarter-hour to an hour of system operation. Power supply for maintaining voltage level is
provided within a shorter operating interval. Grid storage needs are categorized in Figure . according
to network function, power market, and duration of use. Table . compares the various battery
technologies according to discharge time and energy-to-power ratio.
ENERGY STORAGE TECHNOLOGIES
Figure .: Present and Future Battery Technologies
1,000
Pb-acid
Price €/kWh
Available Under development
R&D
200 600 600 300 <150 <150 <150 <150
Ni-Cd Ni-MH Li-ion Future
Li-ion
Zn-air Li-S Li-air
800
600
400
200
Energy density (Wh/kg)
Today
Li–air lithium–air, Li-ion lithium ion, Li–S lithium–sulfur, Ni–Cd nickel–cadmium, Ni–MH nickel–metal hydride, Pb–acid
lead–acid, Zn–air zinc–air.
Source: Second Life-Batteries as Flexible Storage for Renewables Energies,
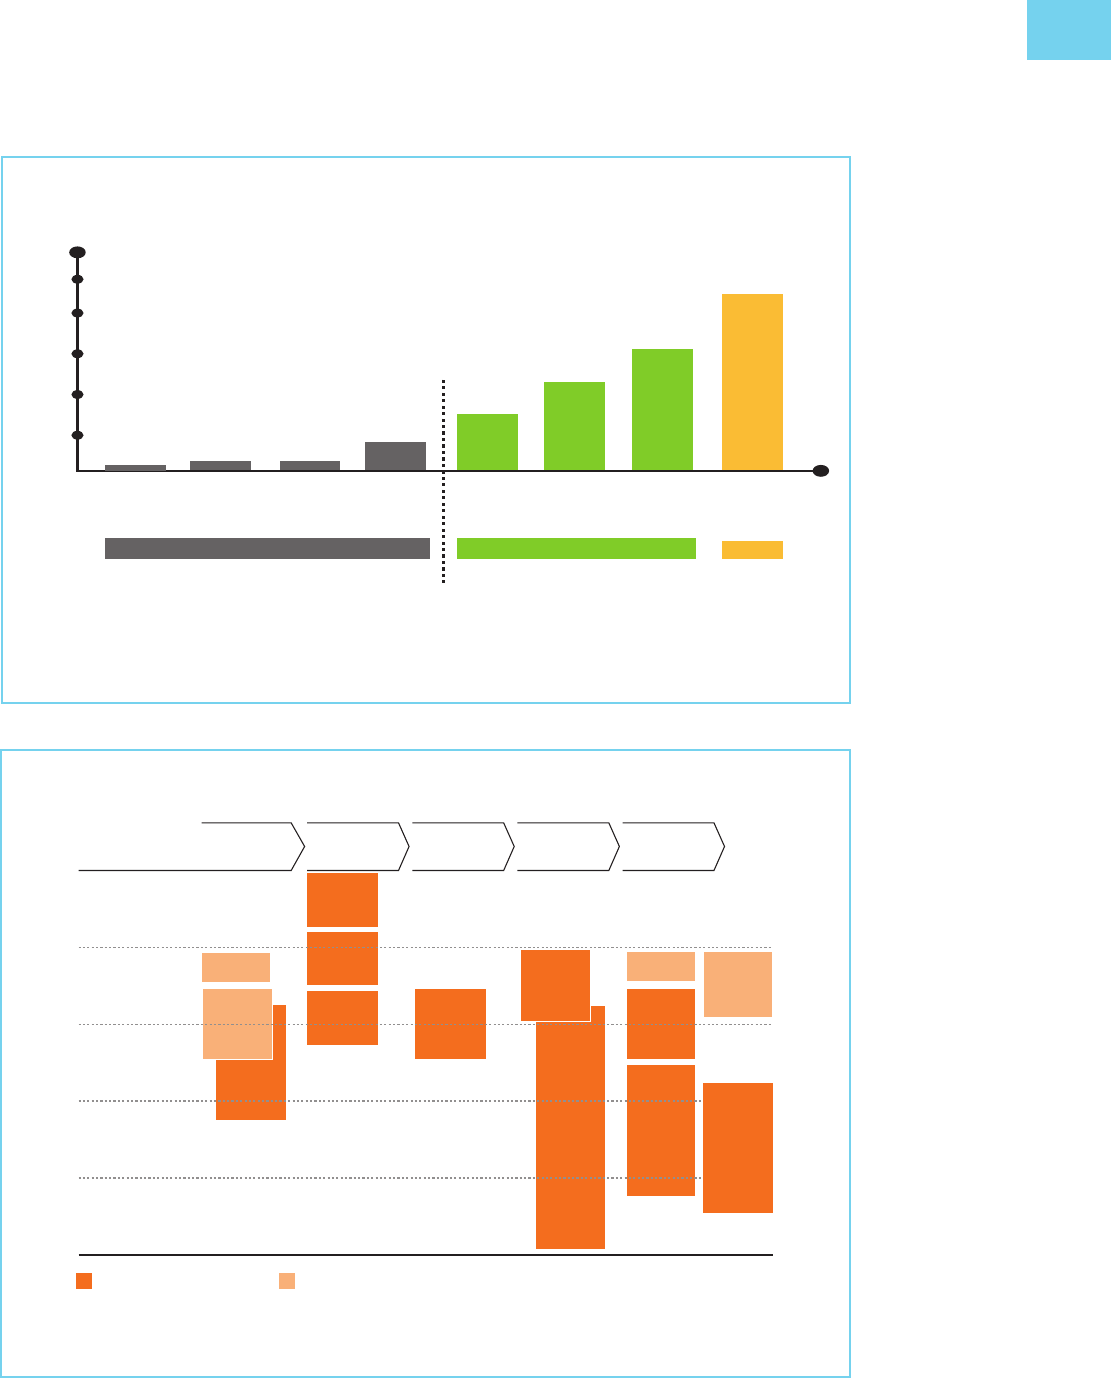
Figure .: Grid Storage Needs along the Value Chain
Duration of need to
deal with fluctuations
Seconds to minutes
Maintain
voltage
level
Maintain
frequency
Network
reinforcement
deferral
Correction
of forecast
inaccuracy
Wholesale
arbitrage
Renewable
energy self-
consumption
Retail
markets
arbitrage
Backup
power
Peak
shaving
Follow load
Avoid
spilling
energy
CHP output
optimization
Black start
Quarter to hour
Daily
Week to month
Seasonal
Need exacerbated by rise of renewables Existing need not affected by new trends
Generators System
operators
Network
operators
Wholesale
market
participants
End users
Off-grid
Source: ROLAND BERGER GMBH (). R. Berger, “Business models in energy storage – Energy Storage can bring utilities back
into the game,” May.

HANDBOOK ON BATTERY ENERGY STORAGE SYSTEM
Table .: Discharge Time and Energy-to-Power Ratio of Dierent Battery Technologies
Discharge Time Energy-to-Power Ratio Technologies
Short (seconds to
minutes)
Less than (e.g., a capacity of less than
kWh for a system with a power of kW)
DLCs, SMES, FES
Medium (minutes to
hours)
Between and (e.g., between kWh and
kWh for a kW system)
FES, EES such as PbA, Li-ion, and Na–S
batteries
EES technologies have relatively similar
technical features. They have advantages over
other technologies in the kW–MW and kWh–
MWh range.
Long (days to
months)
Considerably greater than Redox flow batteries are situated between
storage systems with medium discharge times
and those with long discharge times. But their
rather low energy density limits the energy-to-
power ratio to values between about and .
DLCs and FES have high power density but low
energy density.
Li-ion batteries have both high energy density
and high power density. This explains the broad
range of applications where these batteries are
now deployed.
Na–S and Na–NiCl batteries have higher
energy densities than mature battery types such
as PbA and Ni–Cd, but they have lower power
density than Ni–MH and Li-ion batteries.
Metal–air cells have the highest potential in
terms of energy density.
DLC double-layer capacitor, EES electrochemical energy storage, FES flywheel energy storage, kW kilowatt, kWh kilowatt-
hour, MW megawatt, Li-ion lithium-ion, Na–NiCl
sodium–nickel chloride, Na–S sodium–sulfur, Ni–Cd nickel–cadmium,
Ni–MH nickel–metal hydride, PbA lead–acid, SMES superconducting magnetic energy storage.
Source: Korea Battery Industry Association, Energy Storage System Technology and Business Model, .
ENERGY STORAGE TECHNOLOGIES
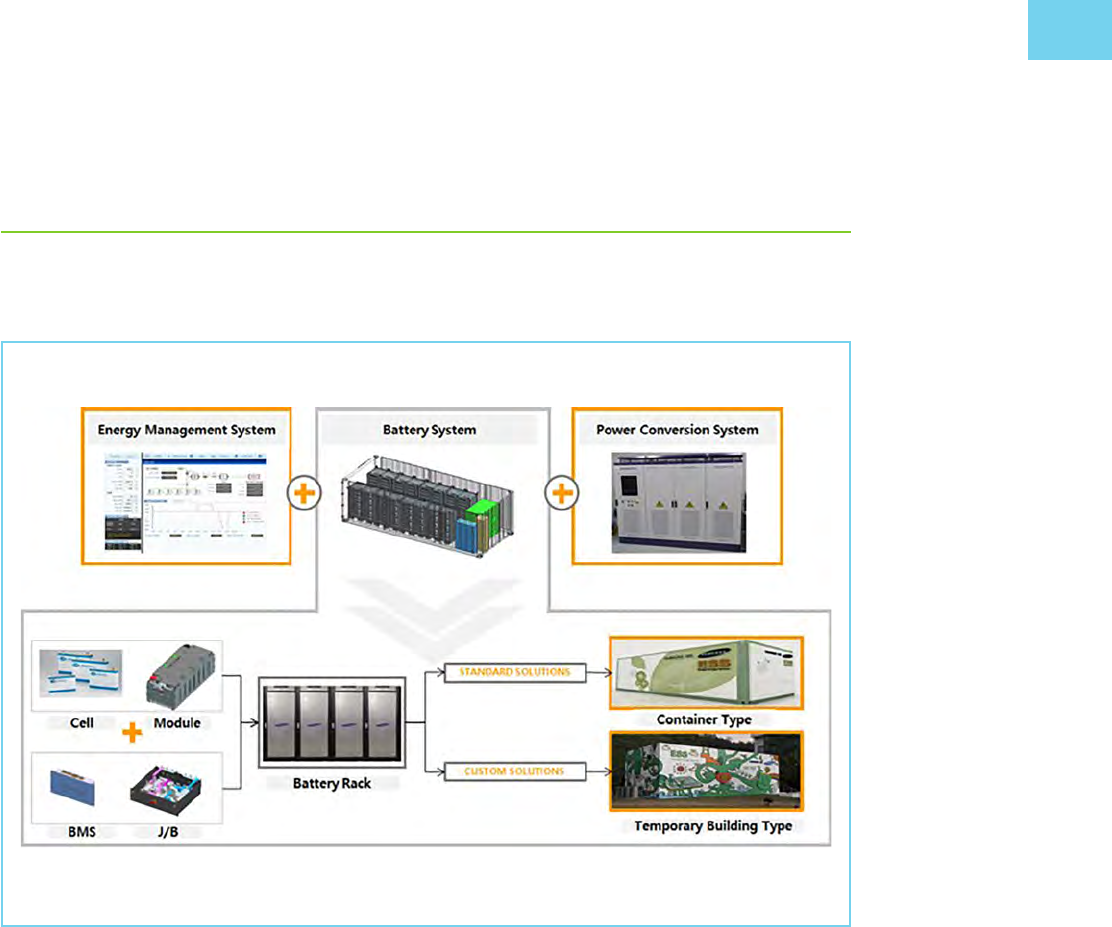
Figure .: Schematic of A Battery Energy Storage System
BMS battery management system, J/B Junction box.
Source: Korea Battery Industry Association “Energy storage system technology and business model”.
. COMPONENTS OF A BATTERY ENERGY STORAGE
SYSTEM BESS
The various components of a battery energy storage system are shown in the Figure . Schematic.
.. Energy Storage System Components
ESS components (Figure .) are grouped according to function into battery components, components
required for reliable system operation, and grid connection components.
• The battery system consists of the battery pack, which connects multiple cells to appropriate
voltage and capacity; the battery management system (BMS); and the battery thermal
management system (B-TMS). The BMS protects the cells from harmful operation, in terms
of voltage, temperature, and current, to achieve reliable and safe operation, and balances
varying cell states-of-charge (SOCs) within a serial connection. The B-TMS controls the
temperature of the cells according to their specifications in terms of absolute values and
temperature gradients within the pack.
• The components required for the reliable operation of the overall system are system control
and monitoring, the energy management system (EMS), and system thermal management.
System control and monitoring is general (IT) monitoring, which is partly combined into the
overall supervisory control and data acquisition (SCADA) system but may also include fire
HANDBOOK ON BATTERY ENERGY STORAGE SYSTEM
protection or alarm units. The EMS is responsible for system power flow control, management,
and distribution. System thermal management controls all functions related to the heating,
ventilation, and air-conditioning of the containment system.
• The power electronics can be grouped into the conversion unit, which converts the power
flow between the grid and the battery, and the required control and monitoring components—
voltage sensing units and thermal management of power electronics components (fan
cooling).
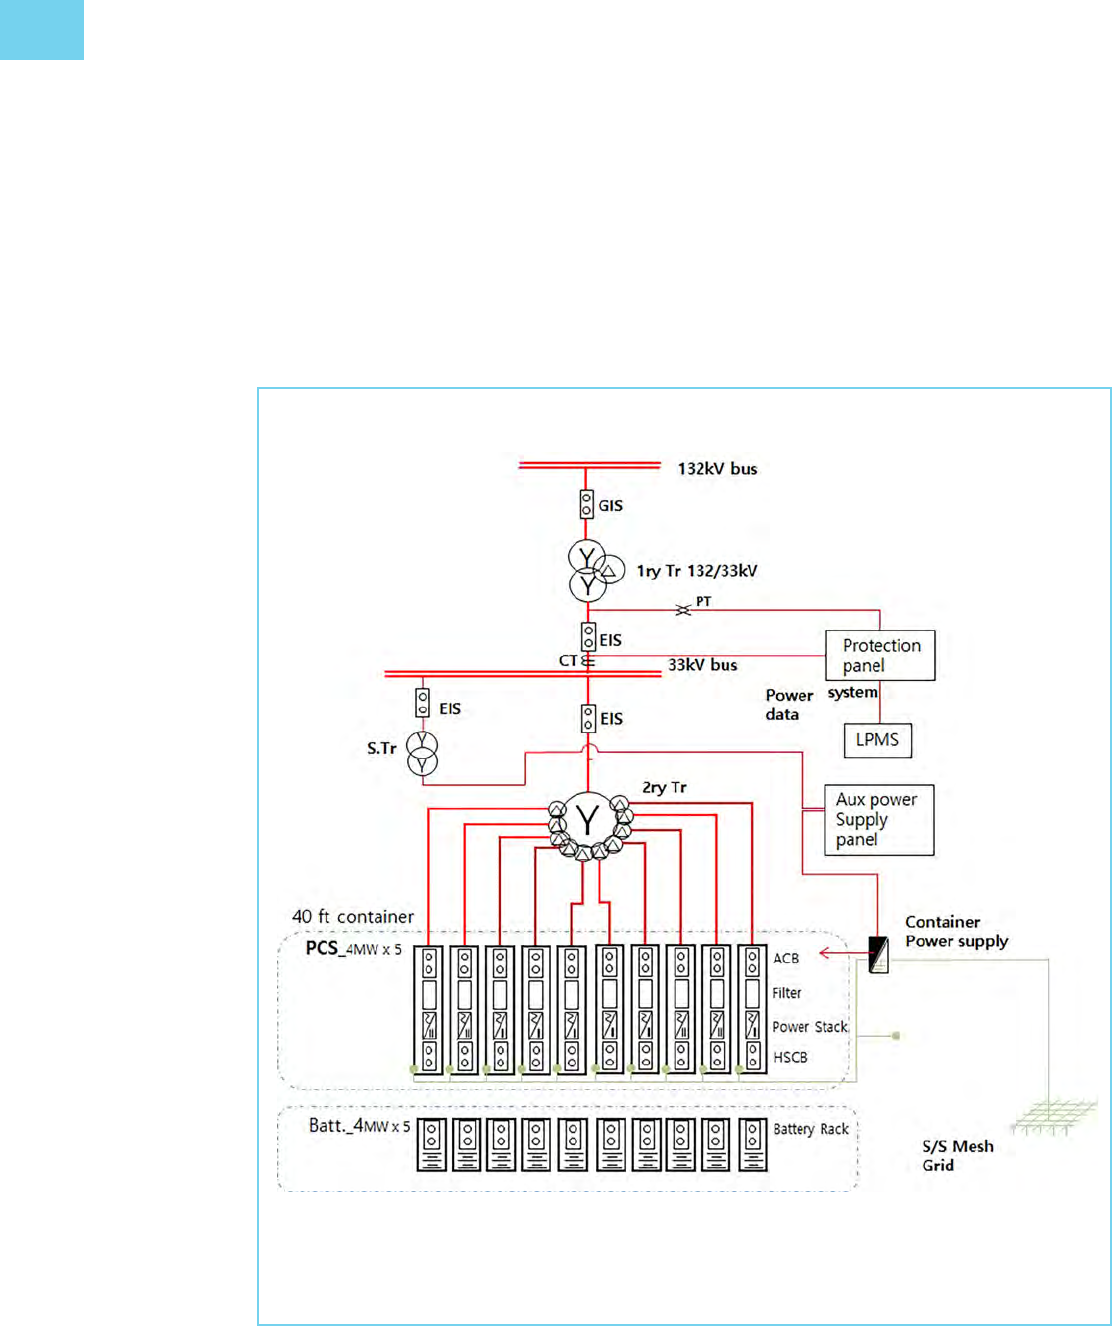
Figure .: Schematic of A Utility-Scale Energy Storage System
ACB air circuit breaker, BESS battery energy storage system, EIS electric insulation switchgear, GIS gas insulation
switchgear, HSCB high-speed circuit breaker, kV kilovolt, LPMS local power management system, MW megawatt,
PCS power conversion system, S/S substation system.
Source: Korea Battery Industry Association “Energy storage system technology and business model”.
ENERGY STORAGE TECHNOLOGIES
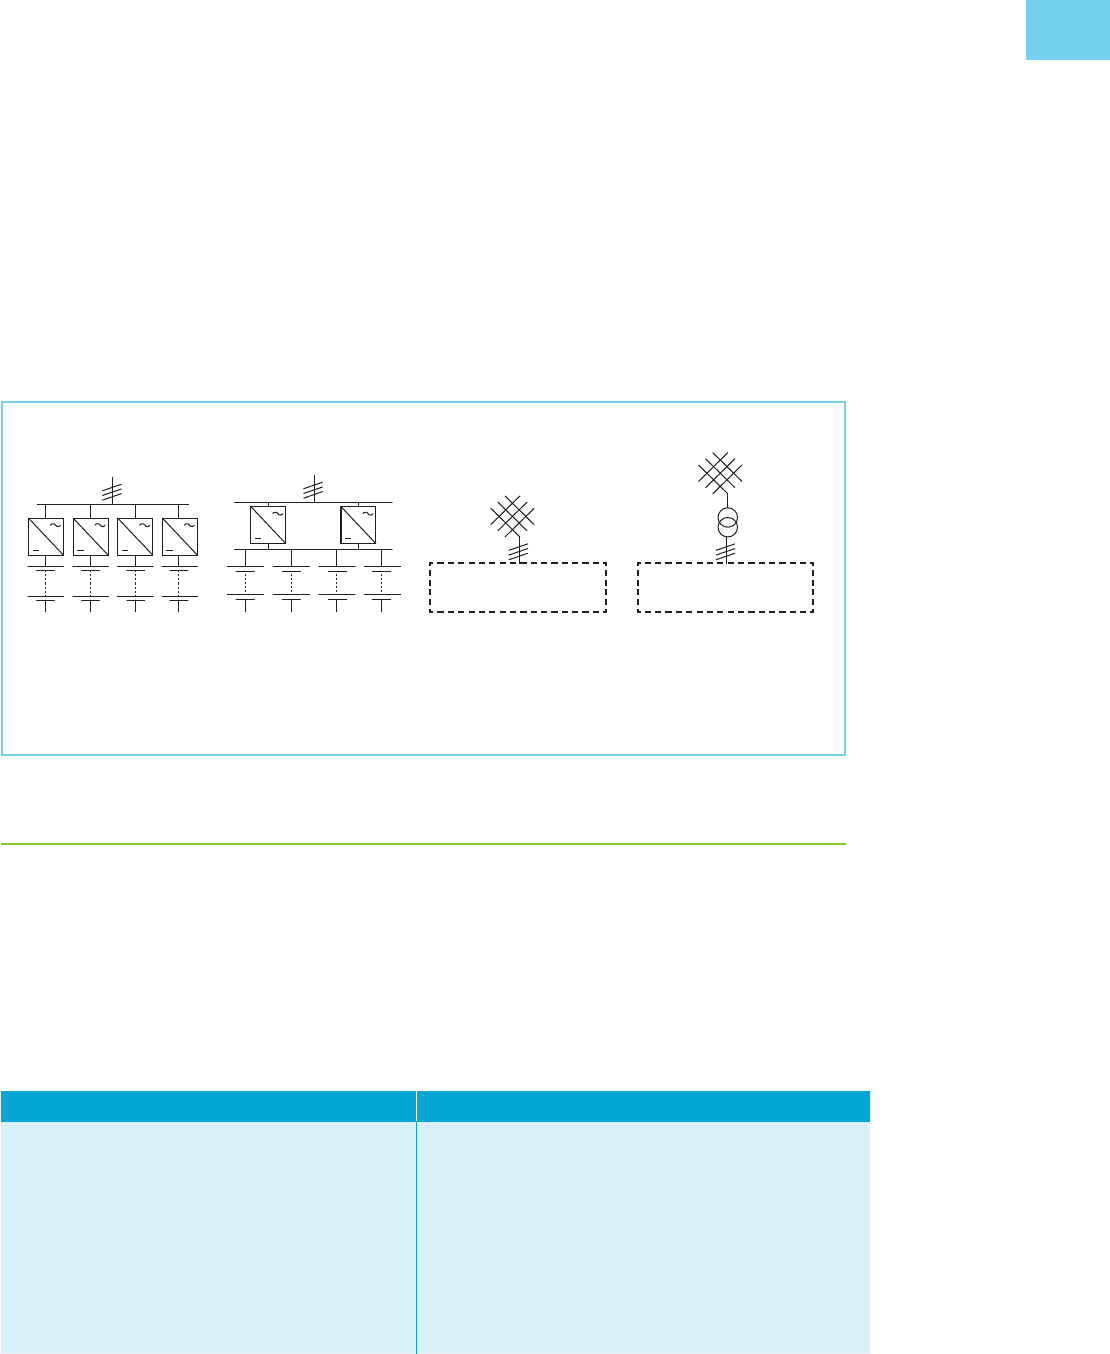
.. Grid Connection for Utility-Scale BESS Projects
Figure . gives an overview of grid connection topologies for utility-scale BESS, which typically consist
of multiple battery packs and inverter units, all adding up to the total system energy and power. Power
electronics units dedicated to individual battery packs can be installed (Figure .a) or the battery packs
can be connected in parallel to a common direct-current (DC) bus (Figure .b). Figure.c shows an
example of grid connection to a low-voltage level, and Figure .d, connection to higher grid levels via a
transformer.
Figure .: Grid Connections of Utility-Scale Battery Energy Storage Systems
(a)
(b) (c)
PE and battery
(d)
PE and battery
PE power electronics.
Source: Hesse et al. (). Lithium-Ion Battery Storage for the Grid—A Review of Stationary Battery Storage System Design
Tailored for Applications in Modern Power Grids, .
. BATTERY CHEMISTRY TYPES
.. Lead–Acid (PbA) Battery
This type of secondary cell is widely used in vehicles and other applications requiring high values of
load current. Its main benefits are low capital costs, maturity of technology, and ecient recycling
(Tables ., ., and .).
Table .: Advantages and Disadvantages of Lead–Acid Batteries
Advantages Disadvantages
Low-cost and simple manufacture
Low cost per watt-hour
High specific power, capable of high discharge currents
Good performance at low and high temperatures
No block-wise or cell-wise BMS required
Low specific energy; poor weight-to-energy ratio
Slow charging: Fully saturated charge takes – hours
Need for storage in charged condition to prevent sulfation
Limited cycle life; repeated deep-cycling reduces battery life
Watering requirement for flooded type
Transportation restrictions for flooded type
Adverse environmental impact
BMS battery management system.
Source: Battery University (). “BU-: How does the Lead Acid Battery Work?,” . [Online]. Available: http://
batteryuniversity.com/learn/article/lead_based_batteries

HANDBOOK ON BATTERY ENERGY STORAGE SYSTEM
Table .: Types of Lead-Acid Batteries
Type Description
Sealed, or
maintenance-
free
First appeared in the mid-s. Engineers deemed the term “sealed lead–acid” a misnomer
because lead–acid batteries cannot be totally sealed. To control venting during stressful charge and
rapid discharge, valves have been added to allow the release of gases if pressure builds up.
Starter Designed to crank an engine with a momentary high-power load lasting a second or so. For its size,
the battery delivers high currents, but it cannot be deep-cycled.
Deep-cycle Built to provide continuous power for wheelchairs, golf carts, and forklifts, among others. This
battery is built for maximum capacity and a reasonably high cycle count.
Source: Battery University (a). “BU-: How does the Lead Acid Battery Work?,” . [Online].
Available: http://batteryuniversity.com/learn/article/lead_based_batteries.
Table .: Uses of Lead–Acid Batteries
Type of Lead–Acid Battery Uses
Sealed lead–acid (SLA) Small UPS, emergency lighting, and wheelchairs. Because of its low price,
dependable service, and low maintenance requirement, the SLA remains
the preferred choice for health care in hospitals and retirement homes.
Valve-regulated lead–acid (VRLA) Power backup for cellular repeater towers, internet hubs, banks, hospitals,
airports, and others.
Absorbent glass mat (AGM) Starter battery for motorcycles, start–stop function for micro-hybrid cars, as
well as marine vehicles and RVs that need some cycling.
RV recreational vehicle, UPS uninterruptible power supply.
Source: Korea Battery Industry Association, Energy Storage System Technology and Business Model, .
.. Nickel–Cadmium (Ni–Cd) Battery
A nickel-cadmium battery (Ni-Cd) is a rechargeable battery used for portable computers, drills,
camcorders, and other small battery-operated devices requiring an even power discharge (Table .).
Table .: Advantages and Disadvantages of Nickel–Cadmium Batteries
Advantages Disadvantages
Rugged, high cycle count with proper maintenance
Only battery that can be ultra-fast-charged with little
stress
Good load performance; forgiving if abused
Long shelf life; can be stored in a discharged state,
needing priming before use
Simple storage and transportation; not subject to
regulatory control
Good low-temperature performance
Economical pricing: Ni–Cd has the lowest cost per cycle
Availability in a wide range of sizes and performance
options
Relatively low specific energy compared with newer
systems
Memory eect; needs periodic full discharge and can be
rejuvenated
Cadmium is a toxic metal; cannot be disposed of in
landfills
High self-discharge; needs recharging after storage
Low cell voltage of . V requires many cells to achieve
high voltage
Ni–Cd nickel–cadmium, V volt.
Source: Battery University (b). “BU-: Nickel-based Batteries,” . [Online]. Available: http://batteryuniversity.com/
learn/article/nickel_based_batteries.

ENERGY STORAGE TECHNOLOGIES
.. Nickel–Metal Hydride (Ni–MH) Battery
The Ni–MH battery combines the proven positive electrode chemistry of the sealed Ni–Cd battery
with the energy storage features of metal alloys developed for advanced hydrogen energy storage
concepts (Moltech Power Systems ).
Ni–MH batteries outperform other rechargeable batteries, and have higher capacity and less voltage
depression (Table .).
The Ni–MH battery currently finds widespread application in high-end portable electronic products,
where battery performance parameters, notably run time, are major considerations in the purchase
decision.
Table .: Advantages and Disadvantages of Nickel–Metal Hydride Batteries
Advantages Disadvantages
Energy density, which can be translated into either long
run times or reduction in the space needed for the battery
Elimination of the constraints imposed on battery
manufacture, usage, and disposal because of concerns
over cadmium toxicity
Simplified incorporation into products currently using
nickel–cadmium batteries because of the many design
similarities between the two chemistries
Greater service advantage over other primary battery
types at extreme low-temperature operation (–C)
Limited service life: If repeatedly deep-cycled, especially
at high load currents, performance starts to deteriorate
after – cycles. Shallow, rather than deep,
discharge cycles are preferred.
Limited discharge current: Although a Ni–MH battery is
capable of delivering high discharge currents, repeated
discharge with high load currents reduces the battery’s
cycle life. Best results are achieved with load currents of
.–. C (one-fifth to one-half of the rated capacity).
Need for a more complex charge algorithm: The Ni-MH
generates more heat during charge and requires a longer
charge time than the Ni–Cd. The trickle charge is critical
and must be controlled carefully.
High self-discharge: The Ni–MH has about higher
self-discharge compared with the Ni–Cd. New chemical
additives improve the self-discharge, but at the expense
of lower energy density.
C(-rate) measure of the rate at which a battery is discharged relative to its maximum capacity, Ni–Cd nickel–cadmium, Ni–MH
nickel–metal hydride.
Source: M. P. systems, “NiMH Technology,” . [Online]. Available: https://www.tayloredge.com/.../Batteries/Ni-MH_Generic.pdf
.. Lithium-Ion (Li-Ion) Battery
Li-ion battery chemistries have the highest energy density and are considered safe. No memory or
scheduled cycling is required to prolong battery life. Li-Ion batteries are used in electronic devices
such as cameras, calculators, laptop computers, and mobile phones, and are increasingly being used
for electric mobility. Their advantages and disadvantages are summarized in Table . and the various
types of such batteries are dierentiated in Table ..

HANDBOOK ON BATTERY ENERGY STORAGE SYSTEM
Table .: Advantages and Disadvantages of Lithium-Ion Batteries
Advantages Disadvantages
High specific energy and high load capabilities with power
cells
Long cycle and extended shelf-life; maintenance-free
High capacity, low internal resistance, good coulombic
eciency
Simple charge algorithm and reasonably short charge
times
Need for protection circuit to prevent thermal runaway if
stressed
Degradation at high temperature and when stored at high
voltage
Impossibility of rapid charge at freezing temperatures
(C, F)
Need for transportation regulations when shipping in
larger quantities
Source: Korea Battery Industry Association “Energy storage system technology and business model”.
Table .: Types of Lithium-Ion Batteries
Type Description
Lithium cobalt oxide (LiCoO
) The battery consists of a cobalt oxide cathode and a graphite carbon anode. The
cathode has a layered structure. During discharge, lithium ions move from the
anode to the cathode. The flow reverses on charge. The drawback of Li–cobalt
batteries is their relatively short life span, low thermal stability, and limited load
capabilities.
Lithium manganese oxide
(LiMn
O
)
Li-ion with manganese spinel was first published in the Materials Research
Bulletin in . The architecture forms a three-dimensional spinel structure
that improves ion flow on the electrode, resulting in lower internal resistance
and improved current handling. A further advantage of the spinel structure is
high thermal stability and enhanced safety, but the cycle and calendar life are
limited.
Lithium nickel manganese cobalt
oxide (LiNiMnCoO
, or NMC)
One of the most successful Li-ion systems is a cathode combination of nickel–
manganese–cobalt (NMC). Similar to Li–manganese, these systems can be
tailored to serve as energy cells or power cells.
Lithium iron phosphate (LiFePO
) In , the University of Texas (and other contributors) discovered phosphate
as cathode material for rechargeable lithium batteries. Li–phosphate oers
good electrochemical performance with low resistance. This is made possible
with nanoscale phosphate cathode material. The key benefits are high current
rating and long cycle life, besides good thermal stability, enhanced safety, and
tolerance if abused.
Lithium titanate (Li
Ti
O
) Batteries with lithium titanate anodes have been known since the s.
Li–titanate replaces the graphite in the anode of a typical lithium-ion battery
and the material forms into a spinel structure. The cathode can be lithium
manganese oxide or NMC. Li–titanate has a nominal cell voltage of . V, can
be fast-charged, and delivers a high discharge current of C, or times the
rated capacity. The cycle count is said to be higher than that of a regular Li-ion.
Li–titanate is safe, has excellent low-temperature discharge characteristics, and
obtains a capacity of at –C (–F).
C(-rate) measure of the rate at which a battery is discharged relative to its maximum capacity, Li–cobalt lithium–cobalt, Li-ion
lithium-ion, Li–phosphate lithium–phosphate, Li–titanate lithium–titanate, V volt.
Source: Battery University (c). “BU-: Types of Lithium-ion,” . [Online]. http://batteryuniversity.com/learn/article/
types_of_lithium_ion.

ENERGY STORAGE TECHNOLOGIES
.. Sodium–Sulfur (Na–S) Battery
The Na–S battery or liquid metal battery is a type of molten metal battery constructed from sodium
and sulfur. It exhibits a high energy density, high eciency of charge and discharge (–), and a
long cycle life, and is fabricated from inexpensive materials (Table .).
However, because of its high operating temperatures of C–C and the highly corrosive nature
of sodium polysulfides, such cells are primarily used for large-scale nonmobile applications such as
electricity grid energy storage (China News Service, n.d.).
Table .: Advantages and Disadvantages of Sodium–Sulfur Batteries
Advantages Disadvantages
Low-cost potential: Inexpensive raw materials and sealed,
no-maintenance configuration
High cycle life; liquid electrodes
Good energy and power density: Low-density active
materials, high cell voltage
Flexible operation: Cells functional over a wide range of
conditions (rate, depth of discharge, temperature)
High energy eciency: coulombic-ecient,
reasonable resistance
Insensitivity to ambient conditions: Sealed, high-
temperature systems
State-of-charge identification: Voltage rise and top-of-
charge and end-of-discharge
Need to be operated above C
Highly reactive nature of metallic sodium (part of the
material used in construction), which is combustible
when exposed to water
Extra cost of constructing the enclosing structure to
prevent leakage
Stringent operation and maintenance requirements
Source: “Advanced Thin Film Sodium Sulfur Battery,” [Online]. Available: en.escn.com.cn/Tools/download.ashx?id.
.. Redox Flow Battery (RFB)
RFBs are charged and discharged by means of the oxidation–reduction reaction of ions of vanadium or
the like.
They have excellent characteristics: a long service life with almost no degradation of electrodes and
electrolytes, high safety due to their being free of combustible materials, and availability of operation
under normal temperatures (Table .). Table . presents the types of vanadium redox batteries.

HANDBOOK ON BATTERY ENERGY STORAGE SYSTEM
Table .: Advantages and Disadvantages of Redox Flow Batteries
Advantages Disadvantages
Long service life: RFBs have a system endurance period of years,
with an unlimited number of charge and discharge cycles available
without degradation. In addition, the electrolytes can be used
semipermanently.
Versatility: With the output and the capacity of a battery capable
of being designed independently of each other, RFBs allow flexible
design. In addition, the batteries allow a single system to address
both short and long periods of output variation, enabling cost-
eective power generation.
High safety: RFBs are capable of operating under normal
temperatures and are composed of noncombustible or flame-
retardant materials. The possibility of a fire with the batteries is
extremely low.
Complexity: RFB systems require pumps,
sensors, flow and power management, and
secondary containment vessels.
Low energy density: The energy densities of
RFBs are usually low compared with those of
other types of batteries.
RFB redox flow battery.
Source: Sumitomo Electric Industries Ltd. (n.d.).
Sumitomo electric, “Redox Flow Battery,” [Online]. Available: http://global-sei.com/products/redox/.
Table .: Types of Vanadium Redox Batteries
Type Description
Vanadium redox battery (VRB) VRBs use two vanadium electrolytes (V/V and V/V),
which exchange hydrogen ions (H) through a membrane.
Polysulfide–bromine battery (PSB) Sodium sulfide (Na
S
) and sodium tribromide (NaBr
) are
used as electrolytes. The sodium ions (Na) pass through the
membrane during the charging or discharging process.
Zinc–bromine (Zn–Br) battery Solutions of zinc and a complex bromine compound are used as
electrodes.
Source: Sumitomo Electric Industries Ltd. (n.d.).
Sumitomo electric, “Redox Flow Battery,” [Online]. Available: http://global-sei.com/products/redox/.

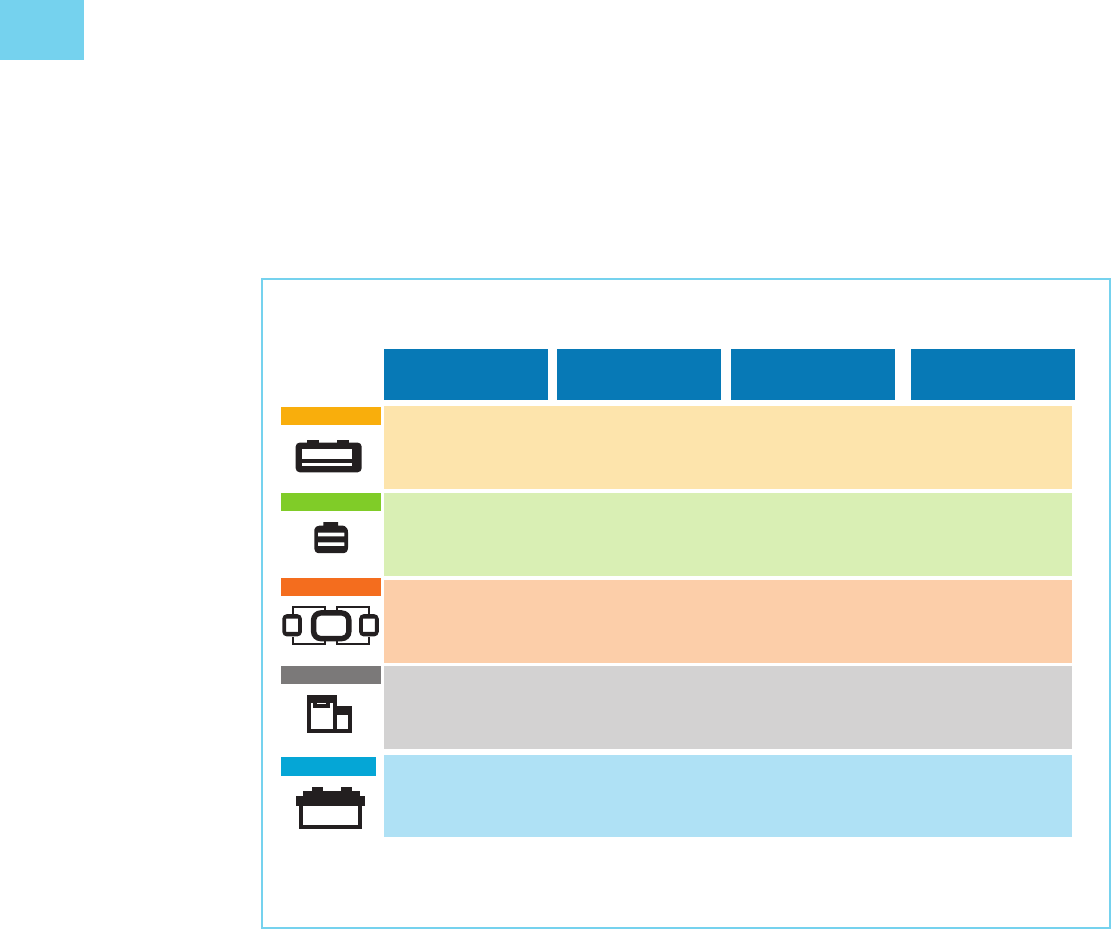
. OWNERSHIP MODELS
There are various business models through which energy storage for the grid can be acquired as shown
in Table .. According to Abbas, A. et. al., these business models include service-contracting without
owning the storage system to outright purchase of the BESS. The needs and preference of the service
user will determine the specific option to be chosen. This chapter presents the general principles for
owning and operating BESS through various options.
Table .: Energy Storage Ownership Models
Wholesale Substation End-Use Customer
Utility-owned
IPP-owned
Supplier-/Vendor-owned
Utility-owned
-Grid asset
-Smart-grid asset
IPP-owned
ESCO-owned
IPP/LSE contract for grid support
services
Customer–owned
ESCO (with aggregator)–owned
IPP–owned
Utility (LSE)–owned
Part of utility program
ESCO energy service company, IPP independent power producer, LSE load-serving entity.
Source: Korea Battery Industry Association “Energy storage system technology and business model”.
.. Third-Party Ownership
In this option, the storage system is owned, operated, and maintained by a third-party, which provides
specific storage services according to a contractual arrangement. This process is very similar to power
purchase agreements signed with independent power producers. Third-Party ownership contracts
similar to those oered to thermal power plants, typically lasting for – years, generally include the
following key terms:
• The o-taker holds the dispatch rights for charging and discharging the energy storage system
(ESS).
• The seller earns a fixed capacity payment (/kW-month) and a variable payment for
operation and maintenance (O&M) per MWh delivered (/MWh).
• In return for the capacity payment, the seller provides assurance of a specified degree of
availability of the plant.
• The seller provides an eciency guarantee.
A. A. Akhil, G. Hu, A. Currier, B. Kaun, D. Rastler, SB Chen, A. Cotter, D. Bradshaw, and W. Gauntlett, Electricity Storage
Handbook, https://prod.sandia.gov/techlib-noauth/access-control.cgi//.pdf, (January ).
BUSINESS MODELS FOR
ENERGY STORAGE SERVICES

HANDBOOK ON BATTERY ENERGY STORAGE SYSTEM
.. Outright Purchase and Full Ownership
In outright purchase and full ownership, the wide dierence in size and functionality between pumped
hydro and compressed-air energy storage (CAES) technologies, on the one hand, and batteries
and flywheels, on the other, creates a clear distinction between their procurement and installation
processes.
.. Electric Cooperative Approach to Energy Storage
Procurement
While investor-owned utilities (IOUs) and electric cooperatives often have similar electricity storage
needs, they dier in ownership, governance, and financial structure, as well as in infrastructure and
customer demographics. These dierences could aect their approach to capital asset ownership.
IOUs operate for profit, are funded by their investors and by public sector and bank borrowings, and are
governed by and generate profits for their shareholders, who may not live in the IOU service area.
Co-op utilities, on the other hand, are not-for-profit entities existing to serve their owner-members,
all of whom live in the co-op service area. Co-ops grew out of the decision of residents of localities
without electricity access—generally those with few and widely dispersed consumers, not enough
to produce a profit for investor-owned power companies—to get that access themselves through
their own power companies. These utilities use loans, grants, and private financing for operation,
maintenance, and modernization. Surplus revenue goes back to the members, depending on their
electricity consumption (patronage dividends). Members have voting rights and a hand in setting
policies and running the business.
Co-op utilities are of two types. Distribution co-ops deliver electricity to their owner-members, while
generation and transmission (G&T) co-ops own and operate generation assets and sell bulk power to
distribution co-ops under all-requirements contracts, thus essentially agreeing to be the single-source
provider of their power needs.
The entity benefiting from the ESS is therefore an important consideration in the choice between
service acquisition options.
A. A. Akhil, et. al. .
BUSINESS MODELS FOR ENERGY STORAGE SERVICES
. FACTORS AFFECTING THE VIABILITY OF
BESS PROJECTS
The economic and financial viability of BESS projects depends on several factors (Table .).
Table .: Key Factors Aecting the Viability of Battery Energy Storage System Projects
Factor Impact on Project Viability
Cost of storage Battery costs, while falling, are still the most significant driver of project viability. Costs
depend on the MW/MWh ratio of the battery.
The terminal value at the end of the project’s economic life also has a bearing, with a
higher terminal value improving project economics.
Network reinforcement cost Higher conventional network reinforcement costs increase the value of deploying
storage as an alternative, improving project economics (and vice versa) for DNOs
directly and for third-party projects with a contract for peak shaving with a DNO.
Commercial services Increased access to and higher value from the provision of commercial services
(for example, ancillary service markets, the wholesale market, the capacity market)
increase project revenue streams, improving project economics (and vice versa).
It is generally accepted that value streams will need to be stacked to increase the
economic viability of BESS projects (see Figure ).
Policy developments Removing barriers to storage or creating a more favorable environment for investment
enhances the realizable value of a project, improving project economics (and vice
versa).
BESS battery energy storage system, DNO distribution network operator, MW megawatt, MWh megawatt-hour.
Source: Korea Battery Industry Association “Energy storage system technology and business model”.
Figure .: Stackable Value Streams for Battery Energy Storage System Projects
Duration
(< 1)1 2 3 4 (> 4)
hours
Microgrid/island
Back-up
Peak Shaving
T&D upgrade deferral
Solar self consumption
Peaking capacity
Renewable integration
Frequency regulation
BESS battery energy storage system, T&D transmission and distribution.
Source: Korea Battery Industry Association “Energy storage system technology and business model”.
HANDBOOK ON BATTERY ENERGY STORAGE SYSTEM
. FINANCIAL AND ECONOMIC ANALYSIS
Based on the Guidelines for the Economic Analysis of Projects by the ADB, project economic analysis
and financial evaluation both involve identifying project benefits and costs during the years in which
they occur and converting all future cash flows into their present value by means of discounting. Both
analyses generate net present value (NPV) and internal rate of return (IRR) indicators.
However, the perspectives and objectives of the two analyses dier:
• Financial evaluation assesses the ability of the project to generate adequate incremental cash
flows for the recovery of financial costs (capital and recurrent costs) without external support.
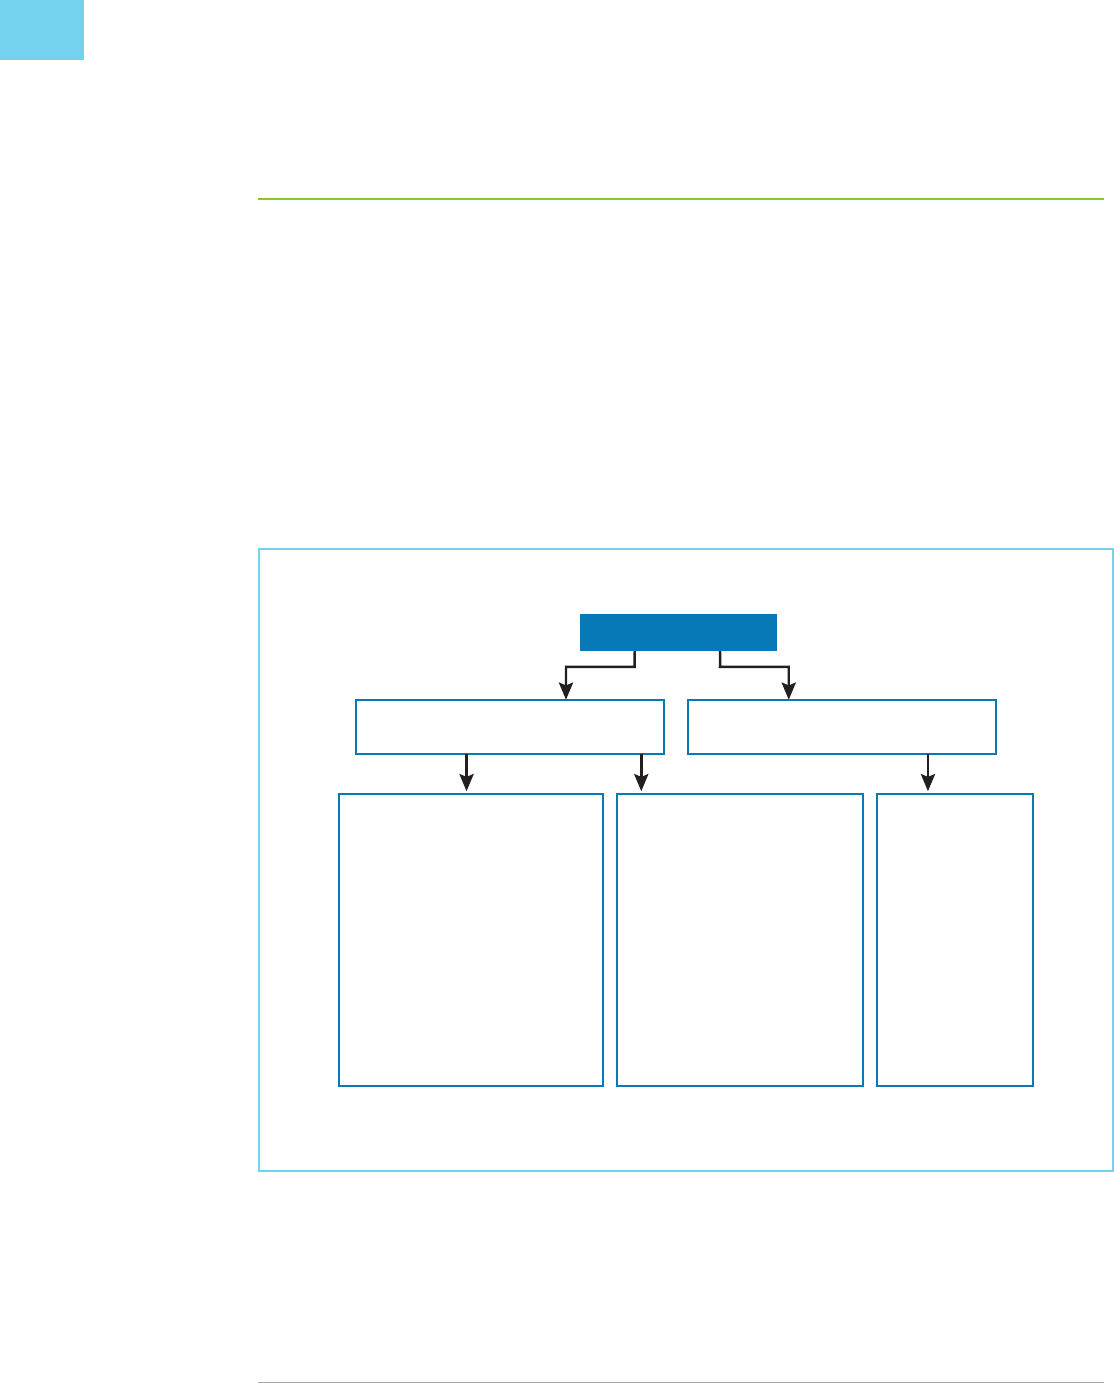
• Project economic analysis (Figure .) assesses whether a project is economically viable for
the country.
In identifying project benefits for economic analysis, two distinctions are particularly important:
• The first is whether the benefits are derived from incremental or from non-incremental
output.
• The second distinction is whether project output is sold in markets, and whether there are
market prices that can be used as the starting point for valuing project benefits.
ADB. . Guidelines for the Economic Analysis of Projects. Manila.
Figure .: ADB Economic Analysis Framework
Gross Projects Benefits
Incremental benefits - from project outputs
that meet additional demand
Outputs are marketed - Revenue
generating projects
Outputs are not marketed -
Nonrevenue generating projects
Basis of benefit identification:
• Sales revenues as the starting
point; or
• Sales revenues plus consumer
surplus when a project reduces
market prices; or
• Consumers’ willingness to pay
estimated using valuation
methods for nonmarketed
impacts when prices are
controlled.
Basis of benefit identification:
• Consumers’ willingness to pay
estimated using stated or revealed
preference methods; or
• Empirical relationship between
projects output and measurable
impact; or
• Benefit transfer when the above
approaches are not feasible
Basis of benefit
identification:
• Domestic resource
cost savings
at economic prices
Nonincremental benefits - from project
outputs that replace existing supply
ADB Asian Development Bank.
Source: ADB Economic Research and Regional Cooperation Deparment.
BUSINESS MODELS FOR ENERGY STORAGE SERVICES
.. Criteria for the Economic Analysis of BESS Projects
Discount rate. The expected net present value (ENPV) and the economic internal rate of return
(EIRR) should be calculated for all projects in which benefits can be valued. The general criterion for
accepting a project is achieving a positive ENPV discounted at the minimum required EIRR or achieving
the minimum required EIRR of .
Shadow exchange rate. Multiplying output and input values measured at world prices and converted
at the ocial exchange rate using the shadow exchange rate factor (SERF), while leaving those at
domestic prices unadjusted, brings the former to a common base of measurement with the latter, which
is in the currency of the borrowing country at its domestic price level.
.. Key Assumptions in the Cost–Benefit Analysis
of BESS Projects
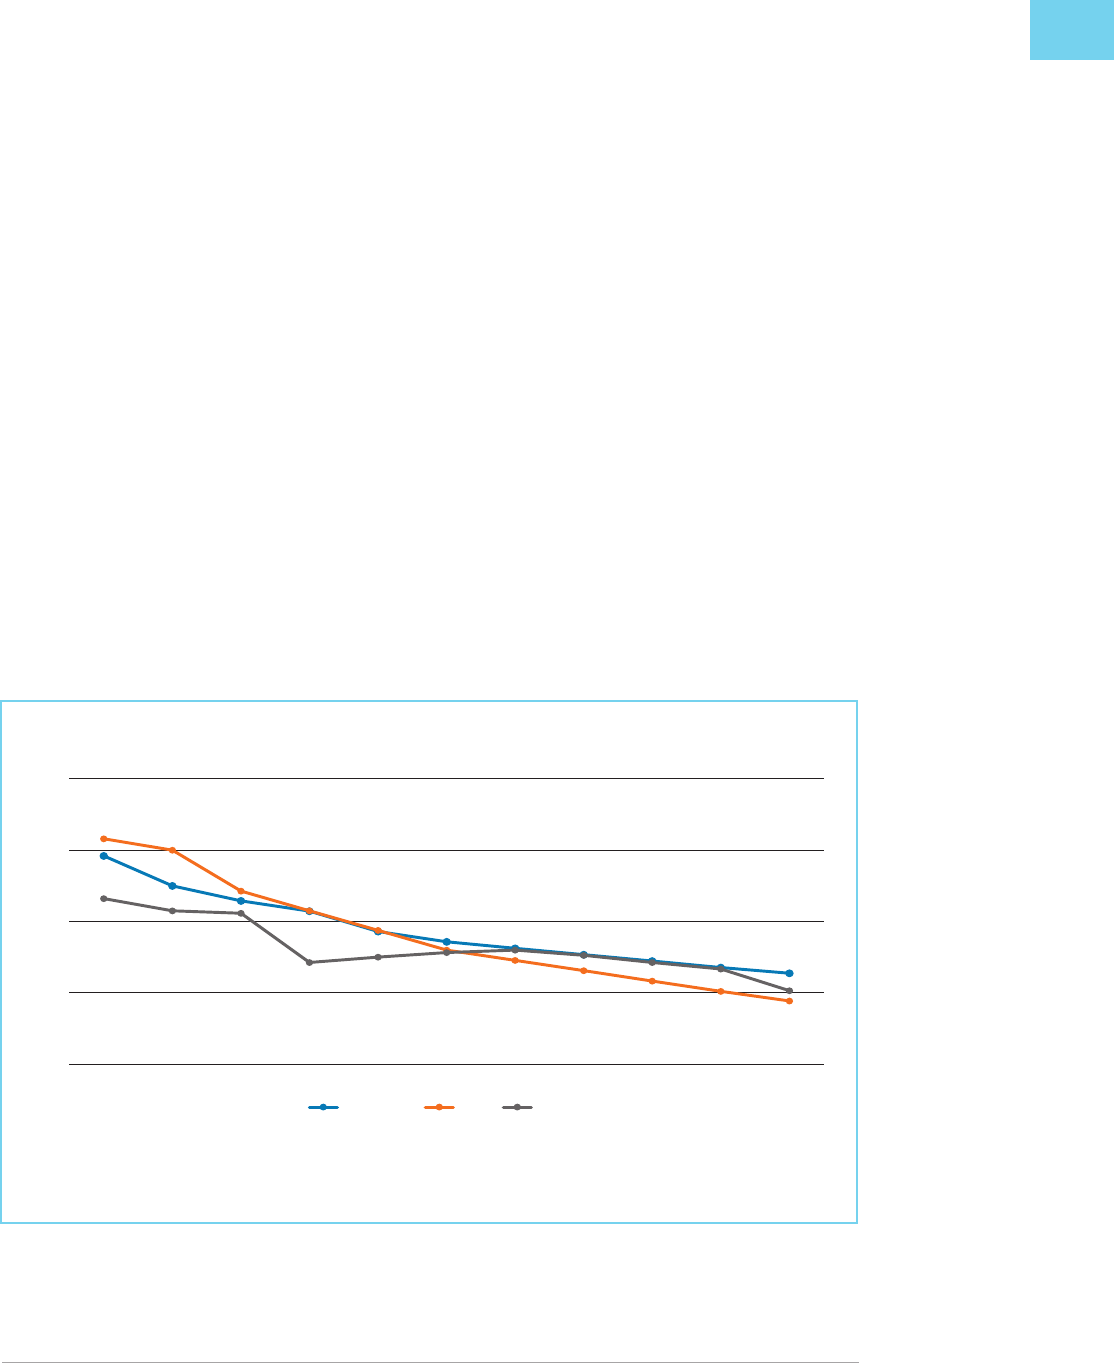
Battery cell prices. The feasibility analysis can be extremely sensitive to the price assumptions for
the terminal value of used cells and the future cost of replacement cells. Lithium-ion cell prices are
expected to continue falling over the next few years as manufacturing capacity ramps up (Figures .
and .).
ADB, .
The ratio of the shadow exchange rate (SER) to the ocial exchange rate.
Figure .: Expected Drop in Lithium-Ion Cell Prices over the Next Few Years (/kWh)
0
200
400
600
800
2011 2012 2013 2014 2015 2016 2017 2018 2019 2020 2021
Mobile-IT EV ESS
ESS energy storage system, EV electric vehicle, IT information technology, kWh kilowatt-hour.
Source: Korea Battery Industry Association “Energy storage system technology and business model”.
HANDBOOK ON BATTERY ENERGY STORAGE SYSTEM
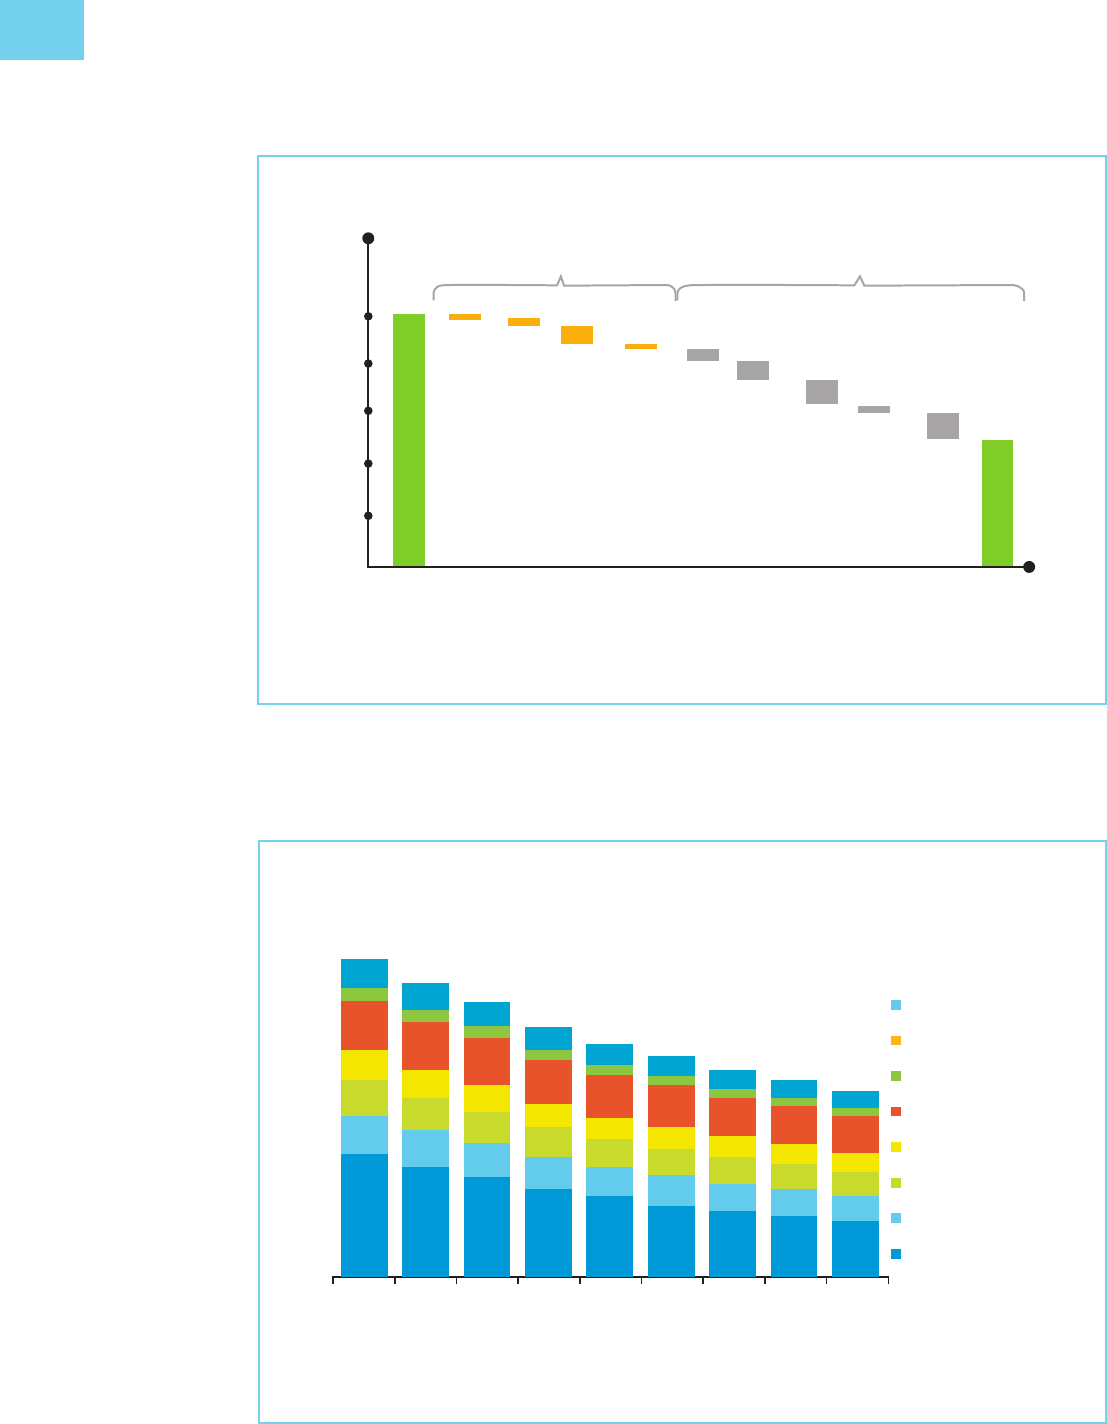
Benchmark capital costs for a fully installed grid-scale energy storage system. A continuous fall
in the capital cost of building grid-scale ESSs is also projected (Figure .).
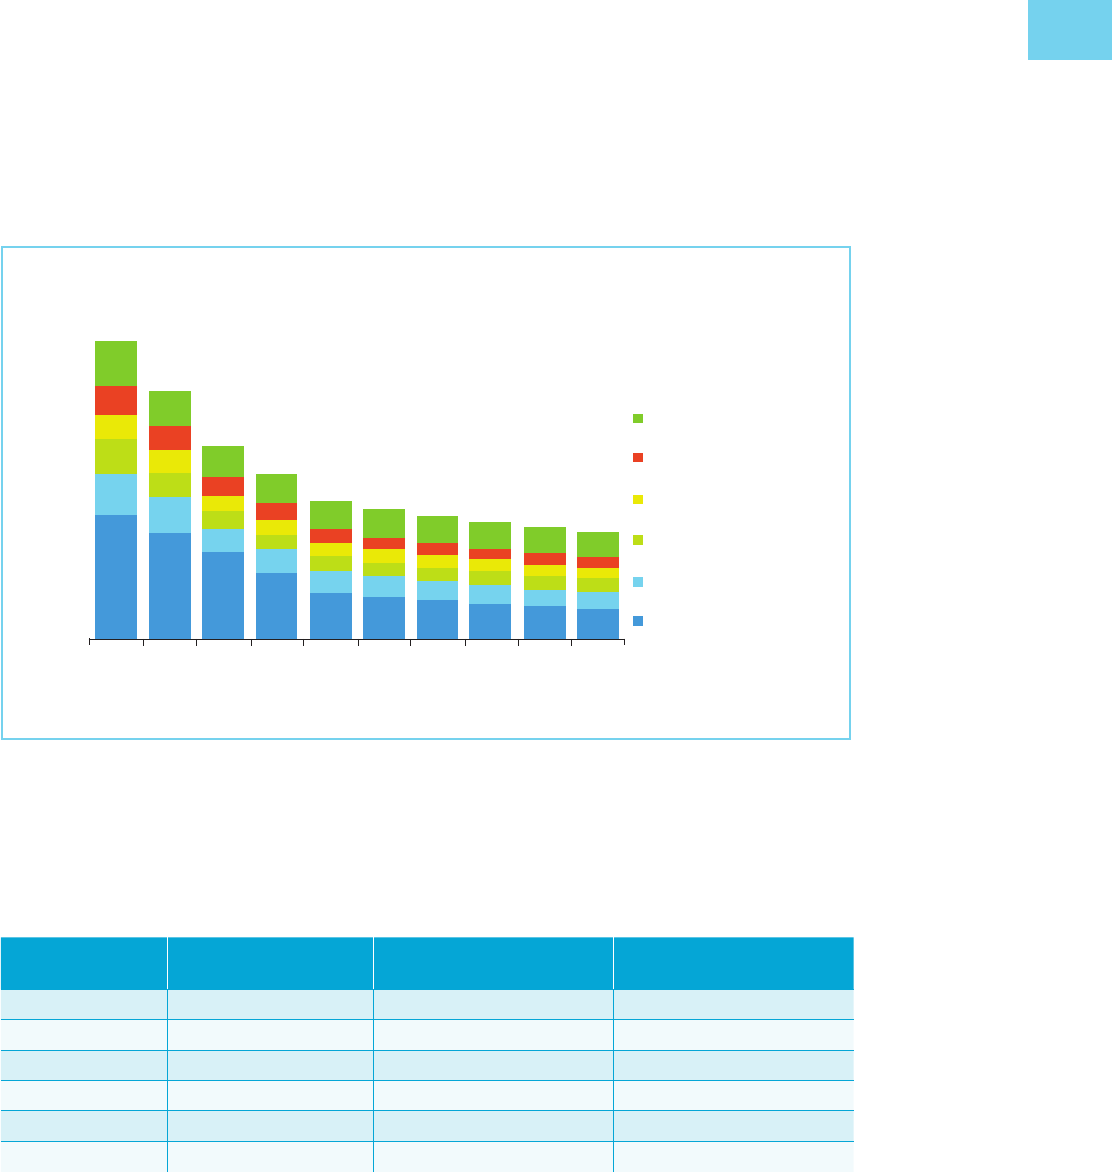
Figure .: Breakdown of Battery Cost, –
Cost (€/kWh)
Technology driver Scale driver
€
Cathode
Anode
Separator
Other
Quality
Control
Pack frame,
hardware
and circuitry
Cell and pack
level labor
Depreciation
Warranty
and others
kWh kilowatt-hour.
Source: Reid and Julve ().
J. J. Gerard Reid, Second-life batteries vs flexible storage for renewables energies, Hannover Messe, April .
Figure .: Benchmark Capital Costs for a MW/ MWh Utility-Sale Energy Storage System
Project (real /kWh)
2017 2018 2019 2020 2021 2022 2023 2024 2025
Developer margin
631
57
27
100
58
68
80
581
53
25
96
54
68
80
544
49
24
93
51
63
71
495
45
21
87
46
59
64
462
42
20
83
44
57
60
435
40
19
81
42
55
57
410
37
18
78
40
53
54
389
35
17
76
38
52
52
369
34
16
74
36
50
50
71
Grid connection
Developer overheads
Energy Management
System
Balance System
PCS
Battery pack
EPC*
241
214
193
172 156 142
54
52
50
EPC engineering, procurement, and construction; ESS energy storage system; MW megawatt; MWh megawatt-hour; PCS
power conversion system.
Source: Bloomberg New Energy Finance (BNEF)
BUSINESS MODELS FOR ENERGY STORAGE SERVICES
Benchmark capital costs for a fully installed residential energy storage system. The capital cost
of residential ESS projects are similarly foreseen to drop over the next few years (Figure .).
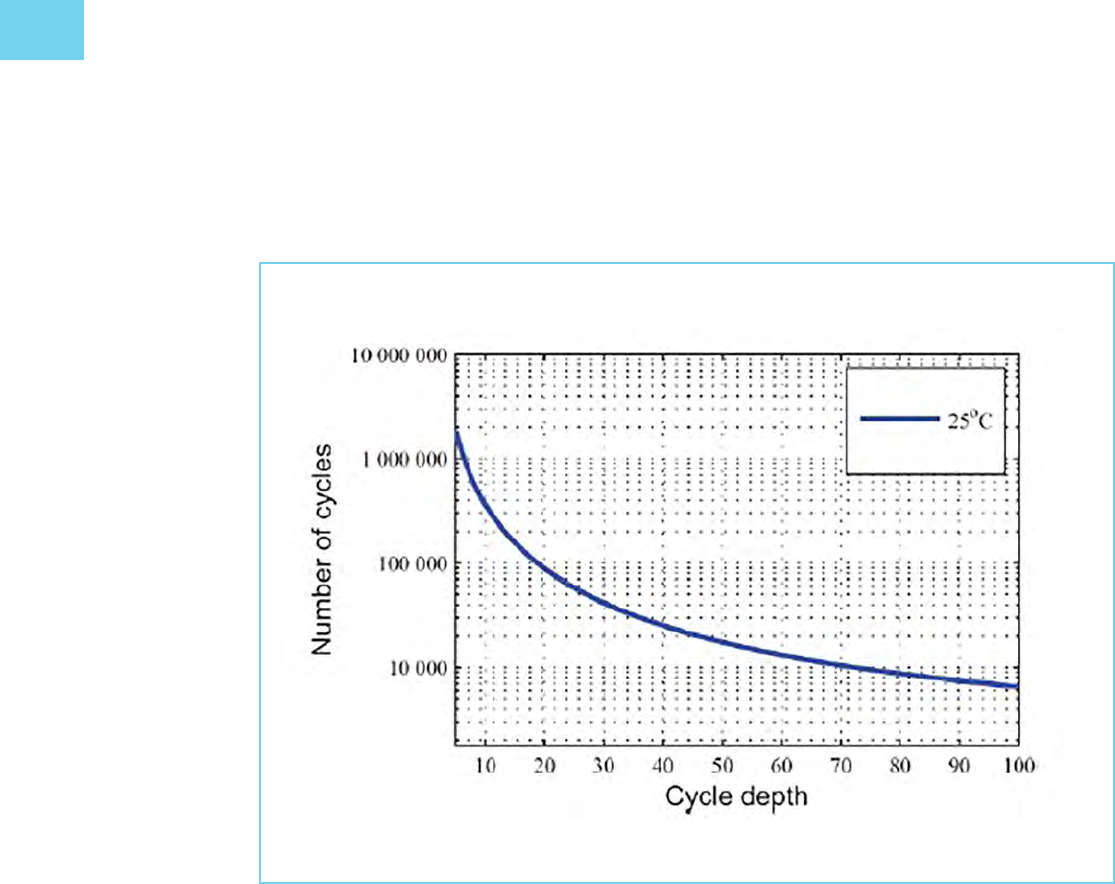
Battery life. The useful life (in cycles) of a battery depends on two factors: cell chemistry and aging.
Cell chemistry includes, anode and cathode materials, cell capacity (in ampere-hours, or amp-hours),
energy density (in watt-hours per liter), and energy-to-power ratio. Table . compares the cell
chemistry of dierent types of lithium-ion batteries.
Table .: Comparison of Dierent Lithium-Ion Battery Chemistries
Cathode Anode
Energy Density
(watt-hours/kg) Number of Cycles
LFP Graphite – –,
LMO Graphite – –,
LMO LTO – ,–,
LCO Graphite – –
NCA Graphite – –,
NMC Graphite, silicone – –,
kg kilogram, LCO lithium–cobalt oxide, LFP lithium–iron–phosphate, LMO lithium–manganese oxide, LTO lithium–titanate
oxide, NCA nickel–cobalt–aluminum oxide, NMC nickel–manganese–cobalt.
Source: IRENA ().
Aging is due to the fading of active materials caused by the charge and discharge cycles. Batteries
discharged below a SOC—more than depth-of-discharge (DOD)—age faster. For example,
a watt-hour lithium–nickel–manganese–cobalt (lithium–NMC) battery cell can perform over ,
cycles at cycle depth, yielding a lifetime energy throughput (the total amount of energy charged
and discharged from the cell) of kWh. But the same cell cycled at cycle depth can perform
only cycles, yielding a lifetime energy throughput of only . kWh. (Figure . shows the lifetime
energy throughput of lithium–iron–phosphate batteries at dierent cycle depths.)
Figure .: Benchmark Capital Costs for a kW/ kWh Residential Energy Storage System Project
(real /kWh)
20172016
151
135
94
86
80
76
73
70
68
49
41
40
101
418
50
43
42
103
437
50
44
44
105
460
55
46
47
107
486
57
49
50
110
518
62
52
60
113
619
67
57
70
118
726
97
82
90
139
936
132
92
108
172
1,122
66
48
40
39
100
401
2018 2019 2020 2021 2022 2023 2024 2025
Installation
Energy Management
System
Balance of plant
Inverter
Battery pack
Soft costs
118
109
129142
156172
246
320
393
467
kW kilowatt, kWh kilowatt-hour.
Source: Bloomberg New Energy Finance (BNEF).
HANDBOOK ON BATTERY ENERGY STORAGE SYSTEM
When carrying out financial and economic analysis, the maximum DOD should be limited to to
prolong battery life, and replacement cell purchase should be considered when the battery reaches
of its useful life (in cycles) to avoid degradation of performance.
Figure .: Lifetime Curve of Lithium–Iron–Phosphate Batteries
Source: Thorbergsson et al. ().
GRID APPLICATIONS OF BATTERY
ENERGY STORAGE SYSTEMS
. SCOPING OF BESS USE CASES
The services provided by batteries can be divided into groups representing the primary stakeholders
(Table .).
Table .: Energy Storage Use Case Applications, by Stakeholder
Stakeholder BESS Services (Use Cases)
Network owners Peak-load management or investment deferral in system reinforcement
Network operators Ancillary services such as frequency regulation or voltage support
“Behind-the-meter” customer
services
Increased self-consumption of solar PV, backup power, peak-time charge
reduction, etc.
BESS battery energy storage system, PV photovoltaic.
Source: Korea Battery Industry Association “Energy storage system technology and business model.”
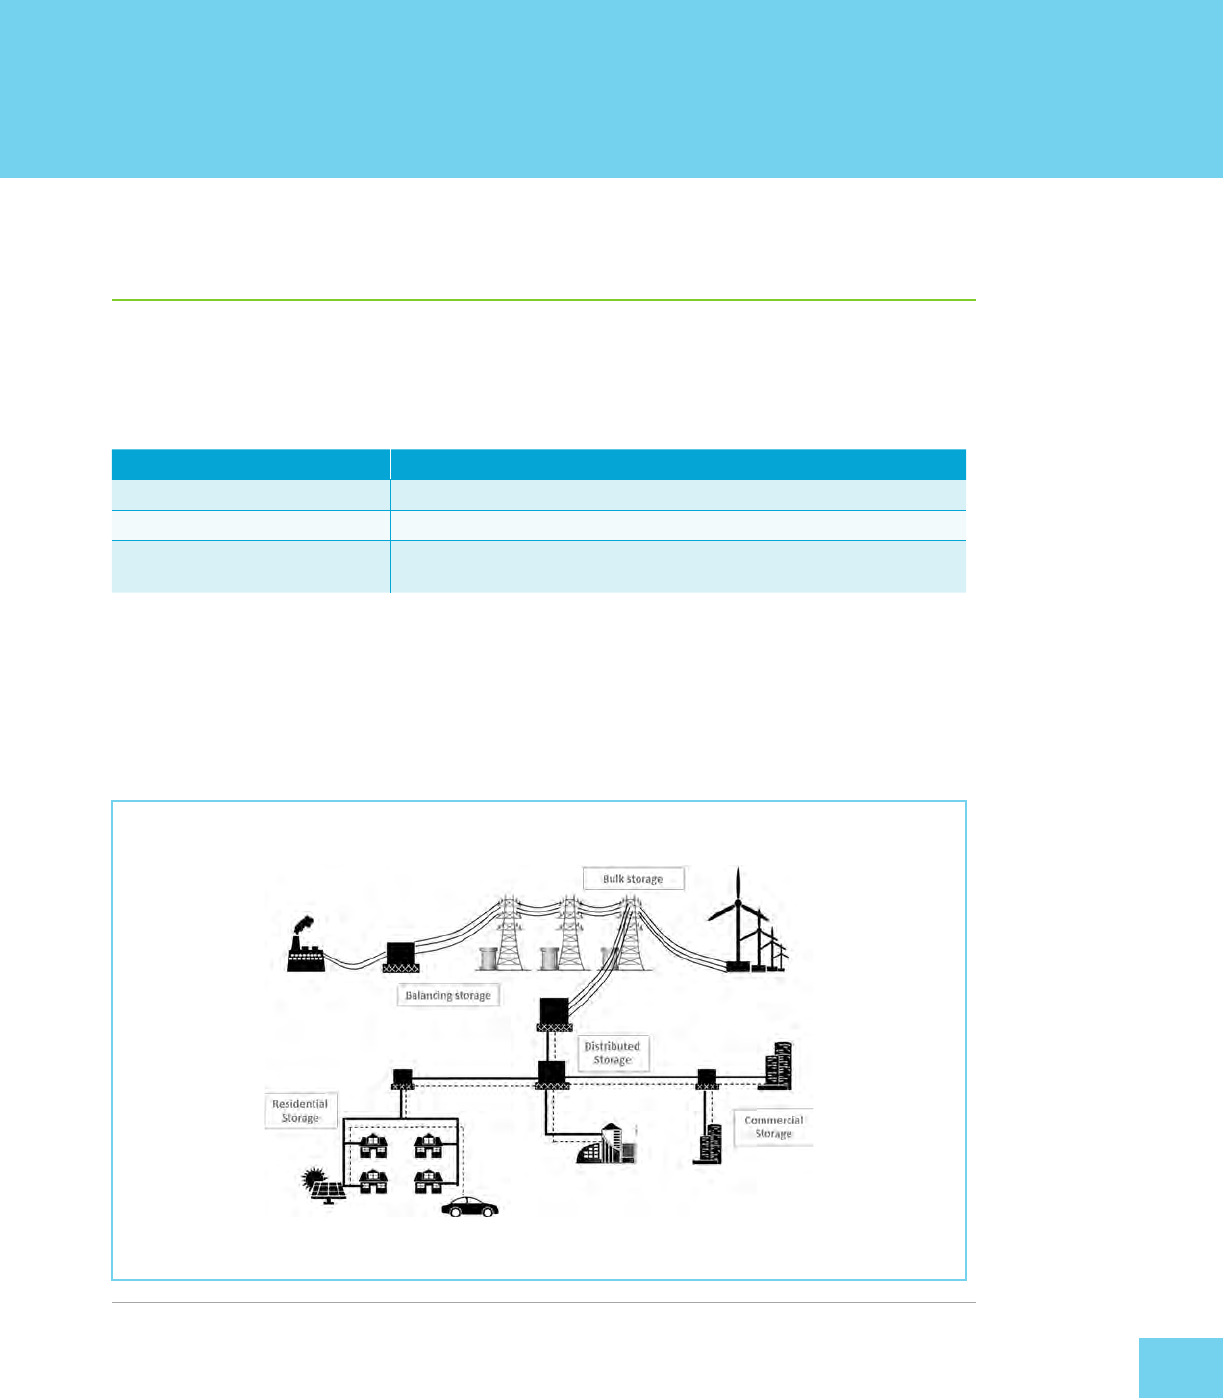
A major advantage provided by battery energy storage is flexibility in addressing the full range of active
and reactive power needs (Figure .). The Rocky Mountain Institute translated this capability into
discrete grid services at the generation, transmission, and distribution levels of the electricity system.
G. Fitzgerald, J. Mandel, J. Morris, and H. Touti. . The Economics of Battery Energy Storage. Rocky Mountain Institute. https://rmi.
org/insight/economics-battery-energy-storage/.
Figure .: Battery Energy Storage System Deployment across the Electrical Power System
Source: Korea Battery Industry Association “Energy storage system technology and business model”.

HANDBOOK ON BATTERY ENERGY STORAGE SYSTEM
. GENERAL GRID APPLICATIONS OF BESS
BESS grid applications are summarized in Table . together with the technical factors involved
according to the Electricity Storage Handbook.
Table .: Technical Considerations for Grid Applications of Battery Energy Storage Systems
Grid Application Technical Considerations
Electric energy time-shift (arbitrage)
Electric energy time-shift involves purchasing inexpensive electric
energy, available during periods when prices or system marginal
costs are low, to charge the storage system so that the stored energy
can be used or sold at a later time when the price or costs are high.
Alternatively, storage can provide similar time-shift duty by storing
excess energy production, which would otherwise be curtailed, from
renewable sources such as wind or photovoltaic.
Storage system size range: – MW
Target discharge duration range: hour
Minimum cycles/year:
Electric supply capacity
Depending on the circumstances in a given electric supply system,
energy storage could be used to defer or reduce the need to buy
new central station generation capacity or purchasing capacity in
the wholesale electricity marketplace.
Storage system size range: – MW
Target discharge duration range: – hours
Minimum cycles/year: –
Regulation
Regulation is one of the ancillary services for which storage is
especially well suited. It involves managing interchange flows with
other control areas to match closely the scheduled interchange
flows and momentary variations in demand within the control area.
The primary reason for including regulation in the power system is to
maintain the grid frequency.
Storage system size range: – MW
Target discharge duration range: minutes to
hour
Minimum cycles/year: –,
Spinning, non-spinning, and supplemental reserves
The operation of an electric grid requires reserve capacity that
can be called on when some portion of the normal electric supply
resources unexpectedly become unavailable. Generally, reserves
are at least as large as the single largest resource (e.g., the single
largest generation unit) serving the system, and reserve capacity is
equivalent to – of the normal electric supply capacity.
Storage system size range: – MW
Target discharge duration range: minutes to
hour
Minimum cycles/year: –
Voltage support
Normally, designated power plants are used to generate reactive power
(expressed in VAr) to oset reactance in the grid. These power plants
could be displaced by strategically placed energy storage within the grid
at central locations or by multiple VAr-support storage systems placed
near large loads, following the distributed approach. The PCS of the
storage systems used for voltage support must be capable of operating
at a non-unity power factor, to source and sink reactive power.
Storage system size range: – MVAr
Target discharge duration range:
Not applicable
Minimum cycles/year: Not applicable
Black start
Storage systems provide an active reserve of power and energy within
the grid and can be used to energize transmission and distribution
lines and provide station power to bring power plants on line after a
catastrophic failure of the grid. Storage can provide similar start-up
power to larger power plants, if the storage system is suitably sited and
there is a clear transmission path to the power plant from the storage
system’s location.
Storage system size range: – MW
Target discharge duration range: minutes to
hour
Minimum cycles/year: –
A. Akhil, et. al., .
continued on next page

GRID APPLICATIONS OF BATTERY ENERGY STORAGE SYSTEMS
continued on next page
Table . continued
Grid Application Technical Considerations
Load following/Ramping up of renewables
Load following is characterized by power output that generally changes
as often as every several minutes. The output changes in response to
the changing balance between electric supply and load within a specific
region or area. Output variation is a response to changes in system
frequency, timeline loading, or the relation of these to each other, and
occurs as needed to maintain the scheduled system frequency or
established interchange with other areas within predetermined limits.
Storage system size range: – MW
Target discharge duration range: minutes
to hour
Minimum cycles/year: Not applicable
Transmission upgrade deferral
Transmission upgrade deferral involves delaying utility investments
in transmission system upgrades, by using relatively small amounts of
storage, or in some cases avoiding such investments entirely. Consider
a transmission system with peak electric loading that is approaching
the system’s load-carrying capacity (design rating). In some cases,
installing a small amount of energy storage downstream from the
nearly overloaded transmission node could defer the need for the
upgrade for a few years.
Storage system size range: – MW
Target discharge duration range: – hours
Minimum cycles/year: –
Transmission congestion relief
Transmission congestion occurs when energy from dispatched power
plants cannot be delivered to all or some loads because of inadequate
transmission facilities. When transmission capacity additions do not
keep pace with the growth in peak electric demand, the transmission
systems become congested. Electricity storage can be used to avoid
congestion-related costs and charges, especially if the costs become
onerous because of significant transmission system congestion.
Storage system size range: – MW
Target discharge duration range: – hours
Minimum cycles/year: –
Distribution upgrade deferral and voltage support
Distribution upgrade deferral involves using storage to delay or
avoid investments that would otherwise be necessary to maintain
adequate distribution capacity to serve all load requirements. The
deferred upgrade could be a replacement of an aging or overstressed
distribution transformer at a substation or the re-conductoring of
distribution lines with heavier wire.
Storage system size range: kW– MW
Target discharge duration range: – hours
Minimum cycles/year: –
Power quality
The electric power quality service involves using storage to protect
customer on-site loads downstream (from storage) against short-
duration events that aect the quality of power delivered to the
customer’s loads. Some manifestations of poor power quality are the
following:
• variations in voltage magnitude (e.g., short-term spikes or dips,
longer-term surges or sags);
• variations in the primary -hertz (Hz) frequency at which
power is delivered;
• low power factor (voltage and current excessively out of phase
with each other);
• harmonics (the presence of currents or voltages at frequencies
other than the primary frequency); and
• interruptions in service, of any duration, ranging from a fraction
of a second to several seconds.
Storage system size range: kW– MW
Target discharge duration range: seconds
to minutes
Minimum cycles/year: –

HANDBOOK ON BATTERY ENERGY STORAGE SYSTEM
Grid Application Technical Considerations
Demand charge management
Electricity storage can be used by end users (utility customers)
to reduce their overall costs for electric service by reducing their
demand during peak periods specified by the utility. To avoid a
demand charge, load must be reduced during all hours of the
demand charge period, usually a specified period of time (e.g., a.m.
to p.m.) and on specified days (most often weekdays).
Storage system size range:
kW– MW
Target discharge duration range:
– hours
Minimum cycles/year:
–
kW kilowatt, MW megawatt, MVAr megavolt-ampere reactive, PCS power conversion system, VAr volt-ampere reactive.
Source: Sandia National Laboratories ().
Sandia National Laboratories, “DOE/EPRI Electricity Storage Handbook in Collaboration with NRECA,” DOE, .
. TECHNICAL REQUIREMENTS
.. Round-TripEciency
Round-trip eciency takes into consideration energy losses from power conversions and parasitic
loads (e.g., electronics, heating and cooling, and pumping) associated with operating the energy
storage system. This metric is a key determinant of the cost-eectiveness of energy storage
technologies. Among energy storage options, compressed-air energy storage (CAES) has the lowest
reported eciency (–), and Li-ion batteries have the highest (–).
For energy storage coupled with photovoltaics, eciencies of less than are unlikely to be cost-
eective.
.. ResponseTime
The need for fast response times is expected to be more important for variability-damping than for
load-shifting applications, and hence more relevant to utility-scale photovoltaic generation in this
evaluation. Passing clouds are the primary source of rapid changes in photovoltaic power output. Solar
insolation at a single point can change by more than in seconds.
Changes of this magnitude in power output from utility-scale photovoltaic systems are expected to
occur within minutes.
Photovoltaic power output ramp rates were measured over a year at a photovoltaic system in Hawaii
that operated at capacity. In that study, only . of the one-minute ramps were operating
at greater than capacity and only , at greater than of that capacity.
System operator
experience suggests that a response time of seconds would be adequate to dampen short-term
variability events of significant magnitude.
EPRI (Electric Power Research Institute), “Electricity Energy Storage Technology Options: A White Paper Primer on Applications,
Costs, and Benefits,” Palo Alto, Calif., a.
R. Berger, “Business models in energy storage – Energy Storage can bring utilities back into the game,” May .
J. Johnson. , S. B., E. A., Q. J. and L. C., “Initial Operating Experience of the La Ola . MW Photovoltaic System, Report SAND-
,,” Sandia National Laboratories,
Table . continued

GRID APPLICATIONS OF BATTERY ENERGY STORAGE SYSTEMS
.. LifetimeandCycling
As is the case for eciency, the cost-eectiveness of energy storage is directly related to its
operational lifetime. The lifetime of an ESS depends on many factors, including charge and discharge
cycling, depth of discharge, and environmental conditions. For any application, maximizing the depth
of discharge minimizes the required energy storage capacity. The cycling schedule thus oers the
greatest degree of freedom in design. For residential and commercial applications, one or two cycles
per day—or ,–, lifetime cycles—would be adequate to allow for photovoltaic power
shifting and nighttime storage of cheap grid electricity.
Increasing the magnitude or percentage of power spikes that is tolerated without intervention would
also reduce the lifetime cycling requirement. An energy storage system that is designed to respond
to power spikes that are more than of the photovoltaic nameplate power in a single charge and
discharge cycle might experience many more than , cycles over its lifetime, especially in
cloudier locations.
.. Sizing
Frequency regulation and black start BESS grid applications are sized according to power converter
capacity (in MW). These other grid applications are sized according to power storage capacity (in
MWh): renewable integration, peak shaving and load leveling, and microgrids.
Table .: Sizing Methods for Power and Energy Applications
Sized by power converter capacity [MW] Sized by power storage capacity [MWh]
Frequency regulation, black start Renewable integration, peak shaving and/or load leveling,
microgrids
Examples
BESS Capacity [MW] Frequency gain
[
MW
]
Hz
*
Governor droop [%]
*
System frequency [Hz]
e.g., .
MW
Hz
*
*
Hz MW
BESS Capacity [MWh]
power required [MW]
*
duration required [h]
depth of discharge [%]
*
battery eciency [%]
e.g., MW
*
h
*
MWh
BESS battery energy storage system, h hour, Hz hertz, MW megawatt, MWh megawatt-hour.

HANDBOOK ON BATTERY ENERGY STORAGE SYSTEM
. OPERATION AND MAINTENANCE
Timely operation and maintenance of the facility is required to minimize loss of energy yield, damage
to property, safety concerns, and disruption of electric power supply (Table .). Maintenance is both
preventive and corrective to maximize BESS output and ensure uninterrupted operation.
Table .: Operation and Maintenance of Battery Energy Storage Systems
Function Definition
Operation Monitoring system management, operation status check and repair, data
management and reporting
Corrective maintenance Component and equipment-wise checks and repair, repair work (following
expiration of EPC warranty period), verification of repairs, documentation
Environmental management Vegetation abatement, waste and garbage dumping, battery disposal
Safety management Protection of the ESS facility against criminal acts such as vandalism, theft, and
trespassing
Transmission-line management Transmission-line check and repair work
Spare parts Ample storage of on-site spares with suitable safeguards is crucial for meeting the
performance guarantees maintaining a higher level of BESS uptime than the plant
availability agreement
BESS battery energy storage system; EPC engineering, procurement, and construction; ESS energy storage system.
Source: Korea Battery Industry Association “Energy storage system technology and business model”.
. USE CASES
.. Frequency Regulation
Frequency regulation is the constant second-by-second adjustment of power to maintain system
frequency at the nominal value ( or Hz) to ensure grid stability (Figure .).
If demand exceeds supply, the system frequency falls, and brownouts and blackouts are likely. If utilities
generate more power than consumers demand, the system frequency increases, possibly damaging all
connected electrical devices.
Battery energy storage can provide regulating power with sub-second response times (Figure .). This
makes it an extremely useful asset for grid-balancing purposes.
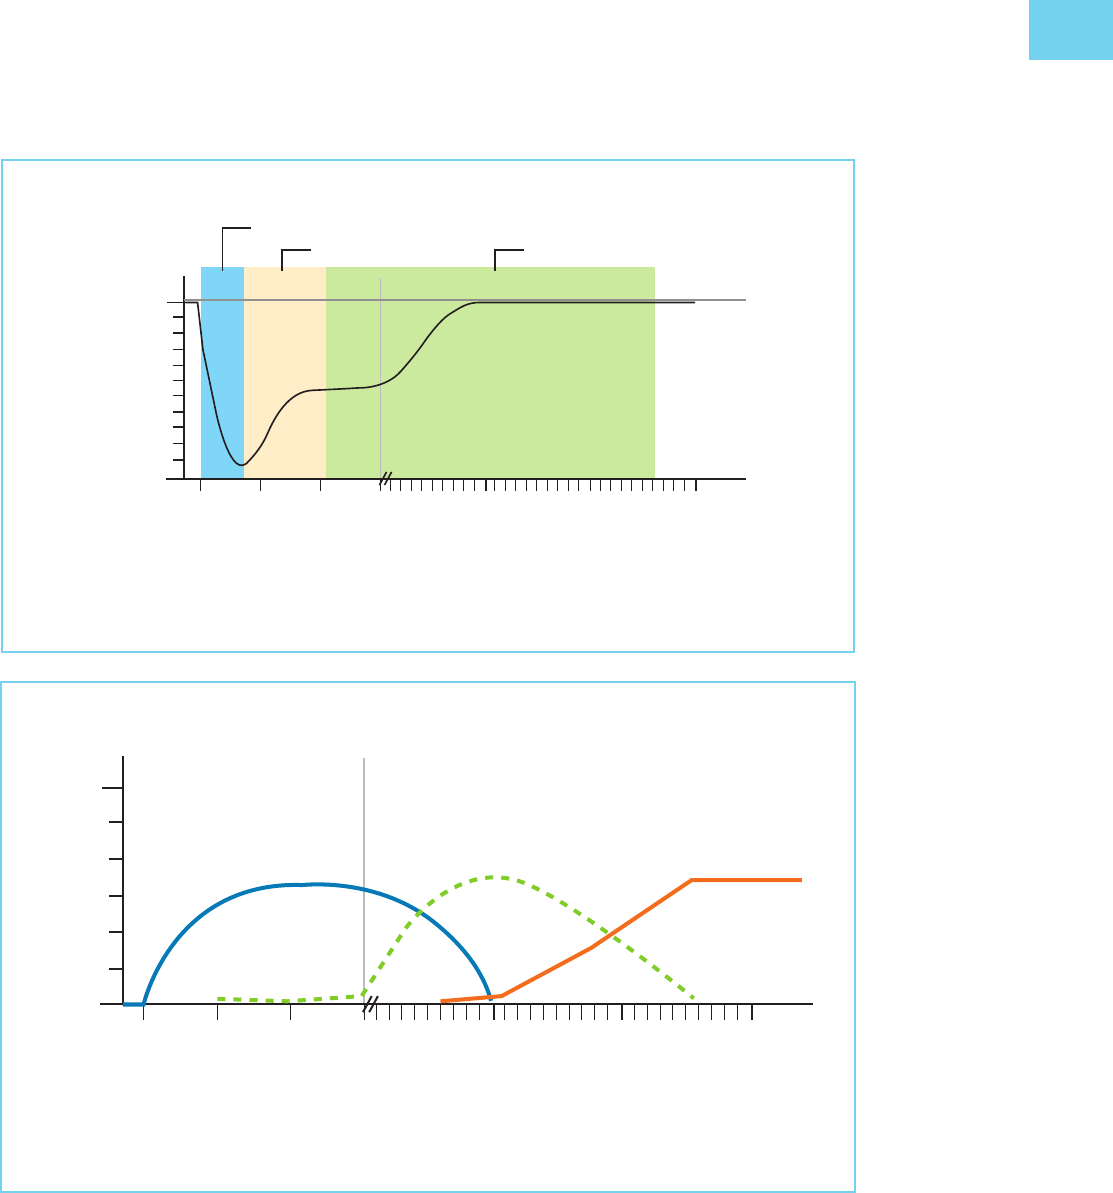
GRID APPLICATIONS OF BATTERY ENERGY STORAGE SYSTEMS
Real-time data, such as battery SOC, rated power or eective power, and system frequency, must be
communicated to the transmission system operator (TSO) using the BESS as part of its pool of assets
for frequency regulation.
Figure .: Frequency Containment and Subsequent Restoration*
Arresting Period
Hz
60.00
59.98
59.90
Rebound Period RecoverPeriod
Seconds
0 10 20 30 10 20 30
Minutes
System Frequency
Hz hertz.
* Following a contingency such as an outage at a large power station.
Source: Sandia National Laboratories ().
Sandia National Laboratories, “DOE/EPRI Electricity Storage Handbook in Collaboration with NRECA,” DOE, .
Figure .: Suitability of Batteries for Short Bursts of Power*
MW
Seconds
0 10 20 30 10 20 30
Minutes
Power
Primary Frequency Control
(Governor response [and
frequency-responsive demand
response])
Secondary Frequency Control
(Generators on Automatic
Generation Control)
Tertiary Frequency Control
(Generators through
operator dispatch)
MW megawatt.
*Such as the case in primary and secondary reserve.
Source: Sandia National Laboratories ().
Sandia National Laboratories, “DOE/EPRI Electricity Storage Handbook in Collaboration with NRECA,” DOE, .
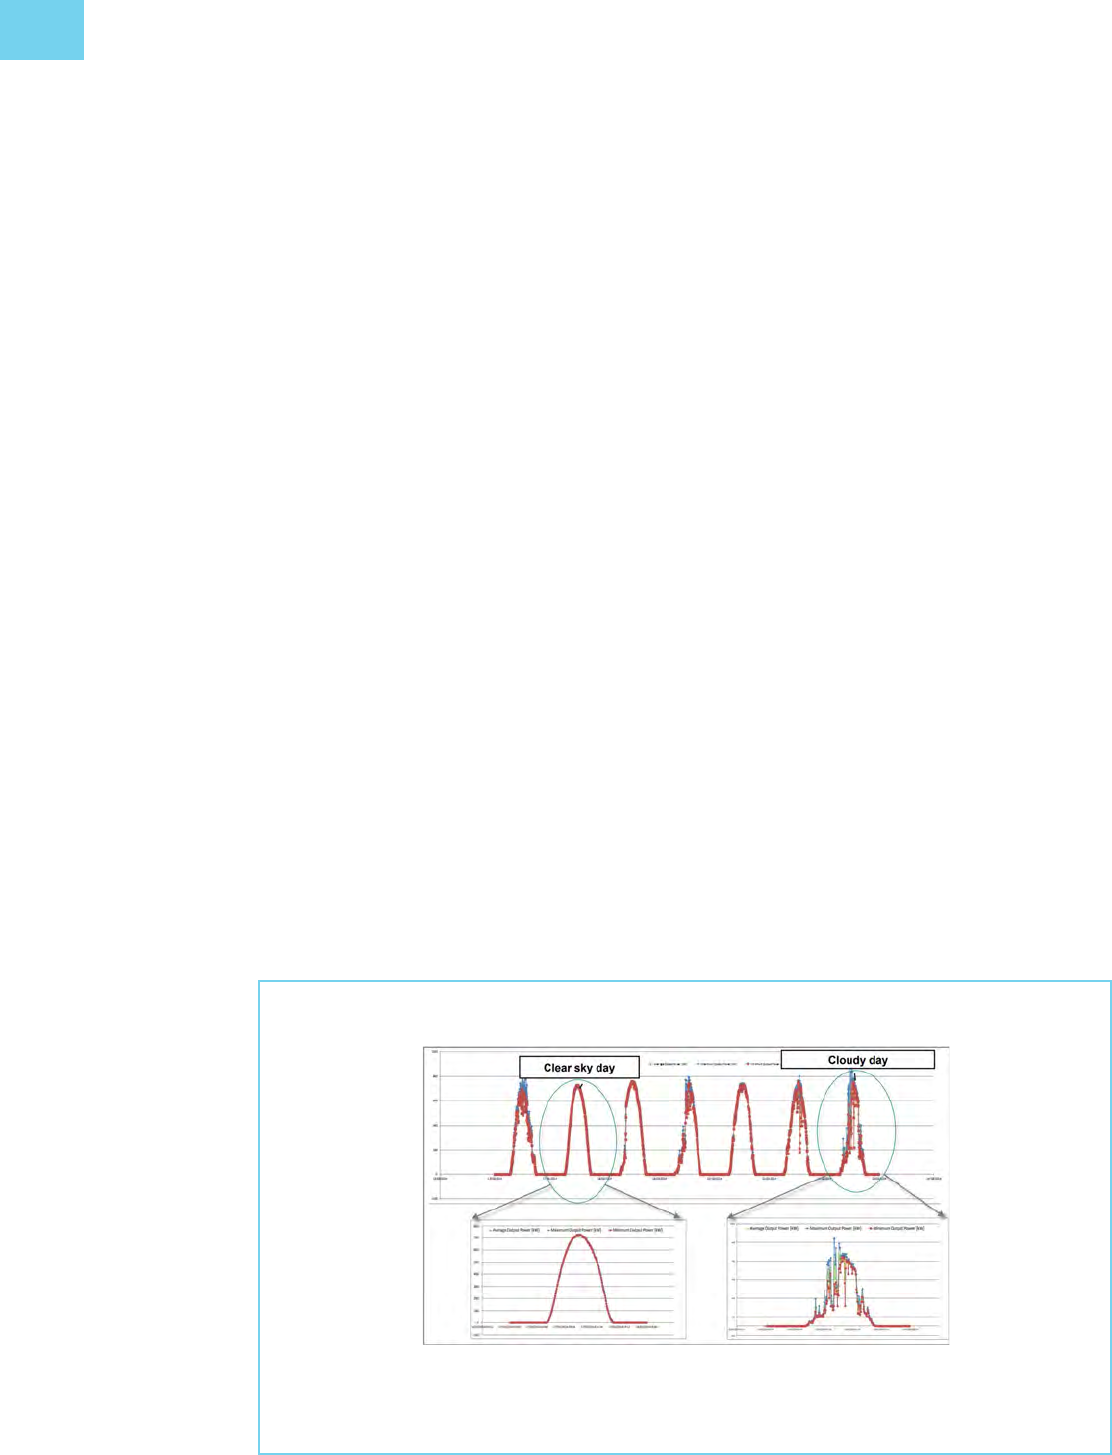
HANDBOOK ON BATTERY ENERGY STORAGE SYSTEM
.. Renewable Energy Integration
Future power systems are expected to rely significantly on renewable energy sources (RESs) such
as wind and solar. However, the variability and intermittence of solar photovoltaic and wind-power
generation present challenges for safe and reliable grid integration:
• Network owners may be penalized for insucient reinforcement of network capacity to
accommodate all network connection requests. In one early case in , the Hawaiian
Electric Company was forced to temporarily stop issuing interconnection permits for
distributed solar installations.
• Distribution system operators may have trouble with system stability and may be forced to
curtail renewable in-feed to avoid over-voltage conditions. TSOs may be forced to hold larger
amounts of spinning reserve to compensate for large forecast errors.
• Network reinforcement and curtailment costs are ultimately recovered from end consumers in
the form of higher taris.
Energy storage provides the power system with flexibility and is very useful in increasing the volume of
renewable power that can be safely and securely connected to the grid:
• More grid connections can be made under existing network capacity as surplus power can be
stored.
• Smoothing of renewable in-feed reduces forecast errors, and thus the need to procure
spinning reserve. Surplus power can be stored at consumers’ homes instead of being fed into
the grid.
• Higher network capacity utilization reduces the burden on consumers as curtailments are
reduced and network reinforcement is minimized.
Solar photovoltaic generation. The overall generation forecast is good, with well-defined peaks.
However, the in-feed can be volatile when there is cloud cover, and large variations can occur minute
by minute (Figures . and .).
Figure .: Rise in Solar Energy Variance on Cloudy Days
Figure 3.4
Source: Enel Green Power ().
Enel Green Power, “EGP Integrating renewable power plants with energy storage,” . [Online]. Available: http://
www.iefe.unibocconi.it/wps/wcm/connect/be-c--da-abeb/SlidesLanuzzagiugno.
pdf?MODAJPERES&CVIDllew
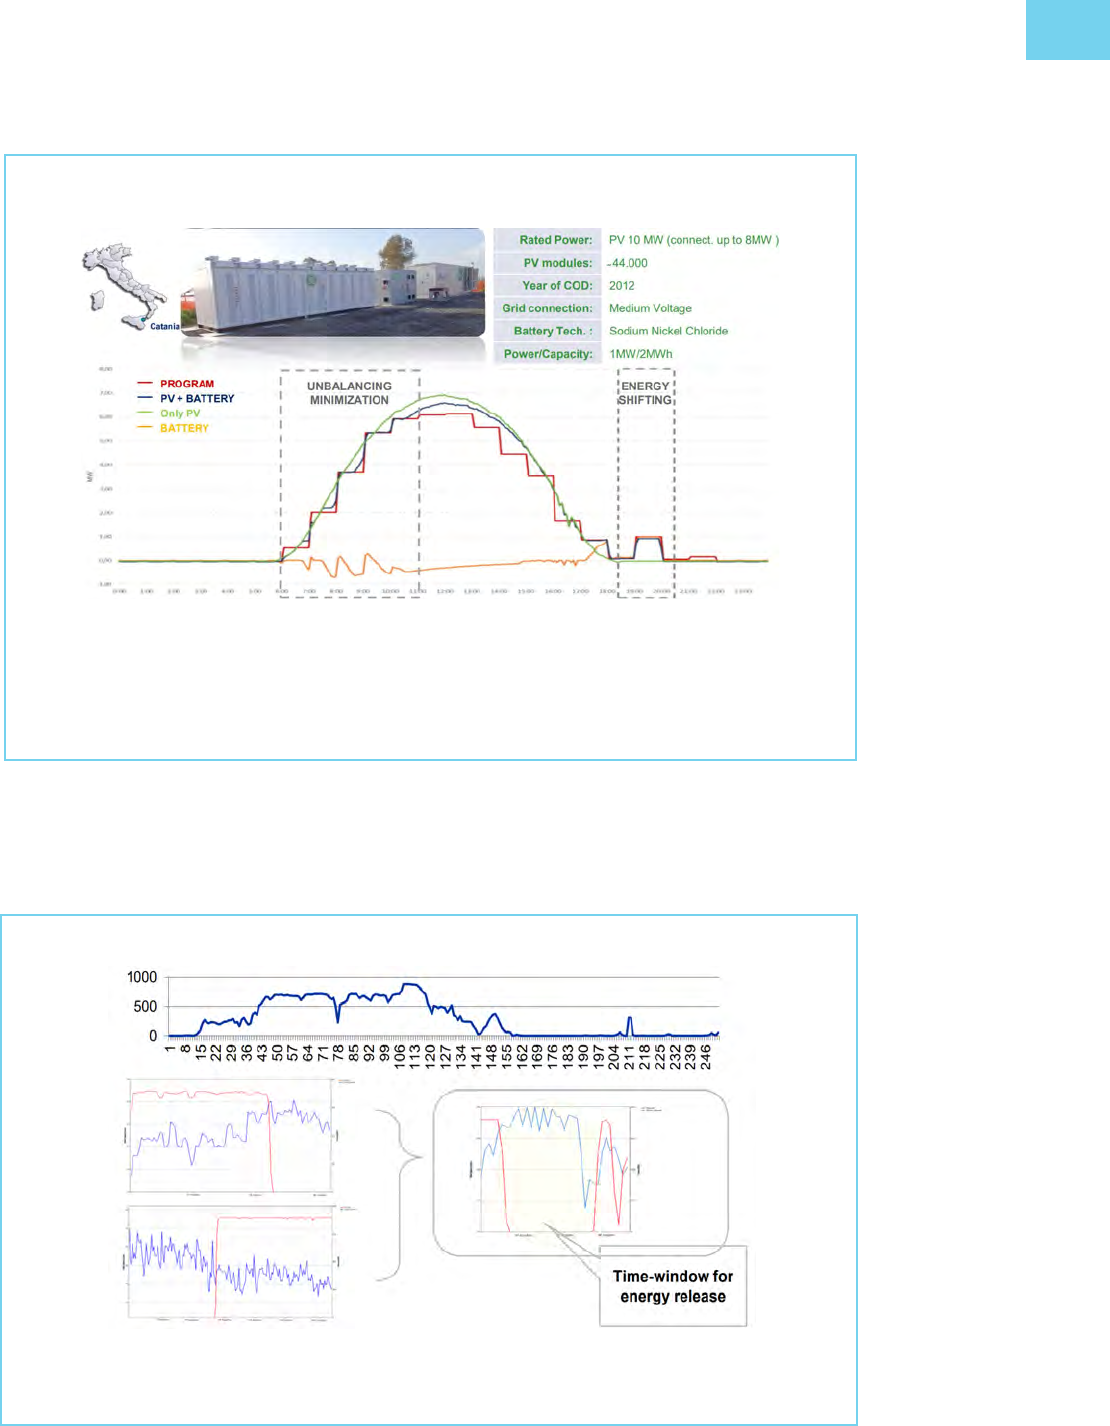
GRID APPLICATIONS OF BATTERY ENERGY STORAGE SYSTEMS
Figure .: Solar Photovoltaic Installation with a Storage System
Figure 3.5
COD commercial operation date, MW megawatt, MWh megawatt-hour, PV photovoltaic.
Source: Enel Green Power ().
Enel Green Power, “EGP Integrating renewable power plants with energy storage,” . [Online]. Available: http://
www.iefe.unibocconi.it/wps/wcm/connect/be-c--da-abeb/SlidesLanuzzagiugno.
pdf?MODAJPERES&CVIDllew.
Wind-power generation. The forecast is more challenging than that for solar photovoltaic. Large
variations can occur within minutes (Figure .). Wind turbines are usually disabled when wind speed
exceeds meters per second, potentially resulting in a large drop in power generation.
Figure .: Illustration of Variability of Wind-Power Generation
Figure 3.6
Enel Green Power, “EGP Integrating renewable power plants with energy storage,” . [Online]. Available: http://
www.iefe.unibocconi.it/wps/wcm/connect/be-c--da-abeb/SlidesLanuzzagiugno.
pdf?MODAJPERES&CVIDllew.
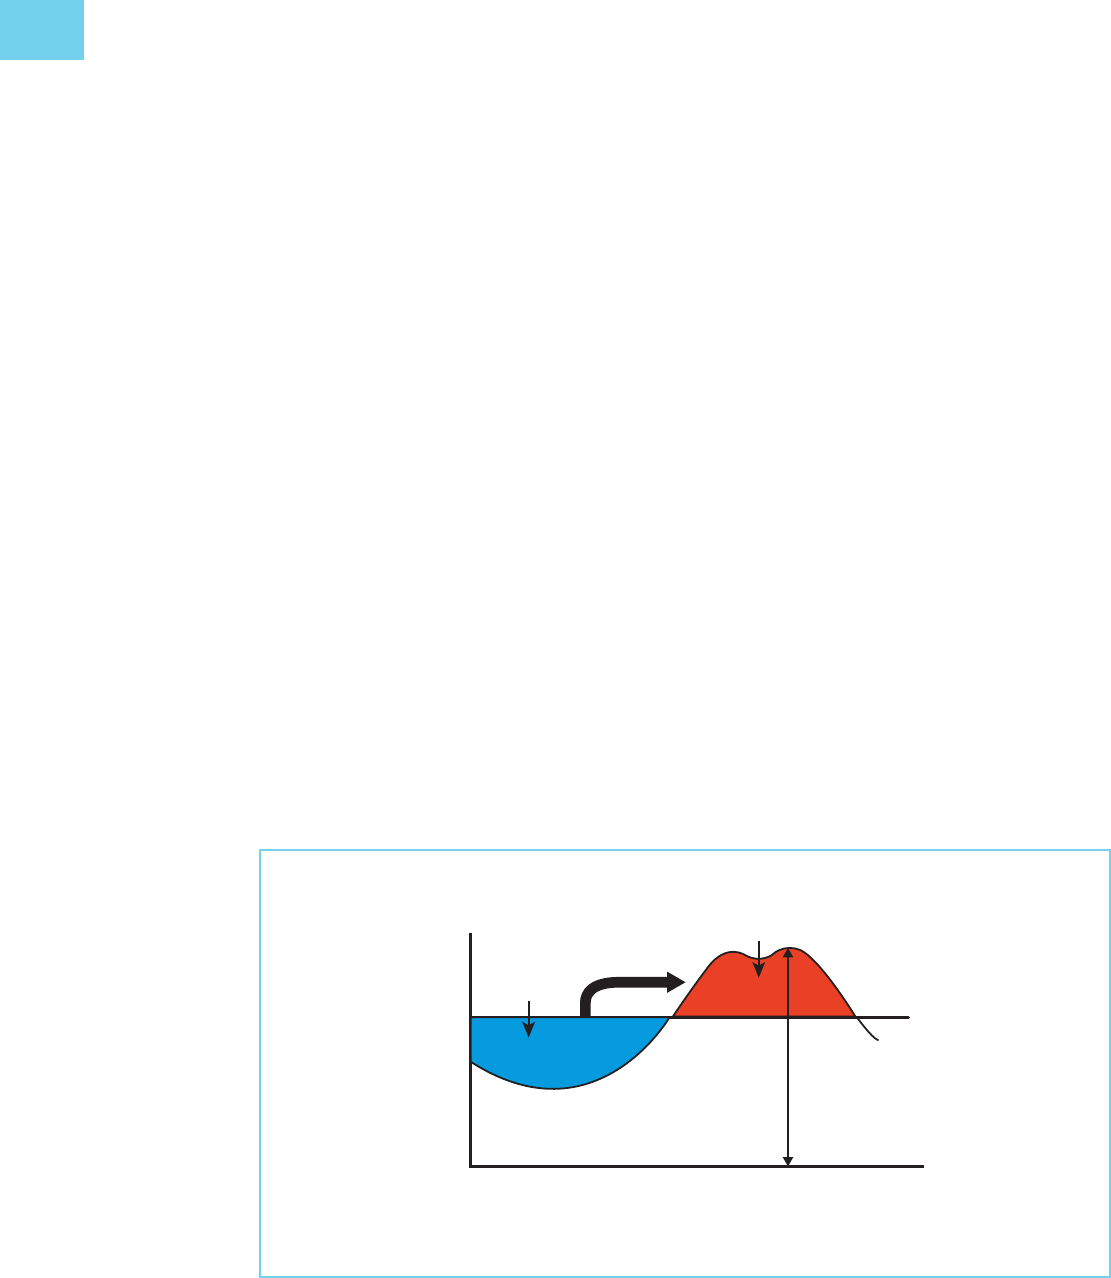
HANDBOOK ON BATTERY ENERGY STORAGE SYSTEM
The main challenges presented by wind-power integration are power intermittence, ramp rate, and
limited wind-farm output. The BESS can improve wind-energy dispatch by reducing forecast errors and
improving the utilization of transmission capacity. The BESS can also be used by the system operator
for providing ancillary services to mitigate the variability and uncertainty of wind power on the grid side.
.. Peak Shaving and Load Leveling
Peak shaving. The reduction of electric power demand during times when network capacity is stressed
is known as peak shaving (Figure .). Peak shaving helps defer investments in network expansion or
network reinforcement.
Peak shaving also helps the utility meet demand without having to ramp up expensive peaking
generators. In the long run, peak shaving allows investment deferral in the building of new power plants.
Customers that install on-site power generation share in those savings by receiving reduced power
taris or in some cases capacity payments (such as in the United Kingdom [UK]).
Peak demand generally occurs in the afternoons:
• In the Republic of Korea: between p.m. and p.m. in July and August, the time of maximum
power demand for air-conditioning and other nonindustrial usage.
• In the UK: between p.m. and : p.m. from November to February, the time of maximum
heating demand.
Peak-shaving generators use special equipment to monitor the electric grid and start up quickly. This
equipment provides the added benefit of backup power in case of rolling backups and grid outages
(Figure .).
Figure .: Use of Energy Storage Systems for Peak Shaving
Average
Demand
Demand
Curve
Peak
Demand
Time
Discharge
Charge ESS
ESS energy storage system.
Source: Korea Battery Industry Association “Energy storage system technology and business model”.
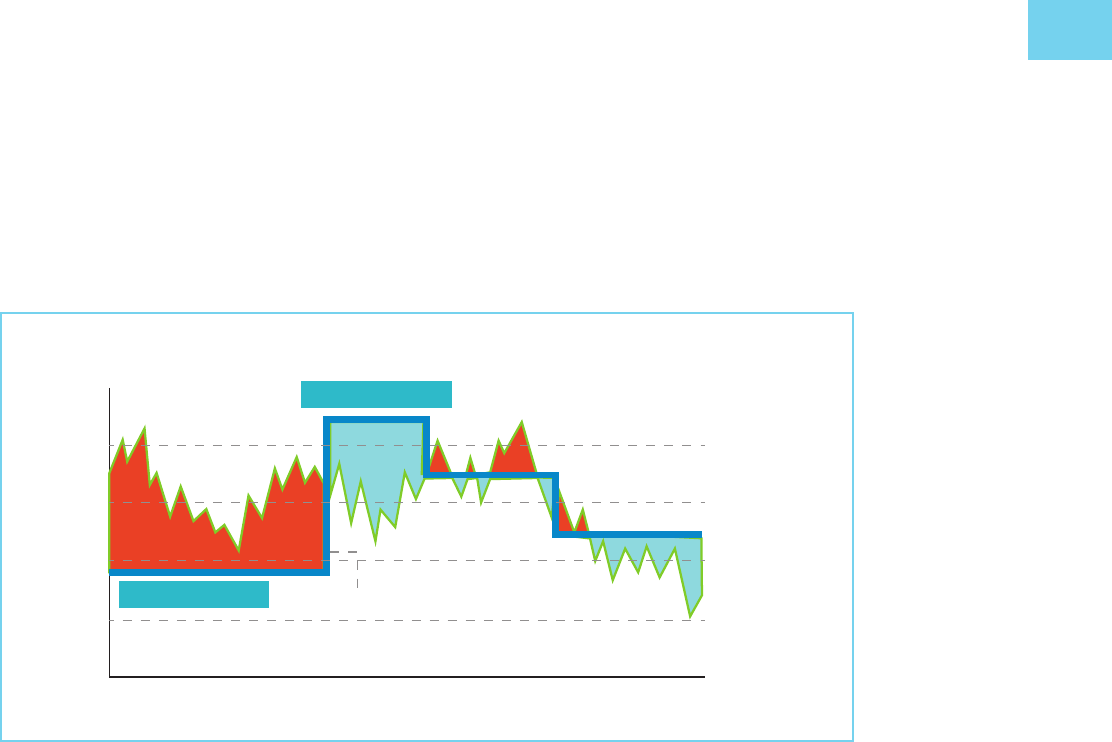
GRID APPLICATIONS OF BATTERY ENERGY STORAGE SYSTEMS
Load leveling. Load leveling, on the other hand, refers to the process of shifting demand away from
peak hours to o-peak hours (Figure .). Load leveling can be performed by introducing time-of-use
taris, whereby consumers are incentivized to shift consumption to hours of the day when taris are
low. Behind-the-meter energy storage allows for load leveling (from the utility perspective) without any
changes to the consumer load profile.
Figure . Use of Energy Storage Systems for Load Leveling
Power
Discharge
Charge
0 12 24 Time
Output for Grid
Peak shaving and load leveling are applications of demand-side management, which can benefit energy
consumers, suppliers, and even housing construction companies.
• Energy consumers benefit in various ways. Reducing peak-time usage of grid-supplied
electricity
– saves energy costs as the battery is charged at night, when grid taris are lower, and
supplies power during daytime peak hours;
– complies with peak-time electricity usage rules, such as that set by the Ministry of
Knowledge Economy of the Republic of Korea, which mandates a reduction in peak-
time electricity usage for the corporate sector;
– reduces the use of electricity beyond the contracted amount, thus reducing overuse
charges;
– complies with carbon dioxide (CO
) reduction regulations; and
– prevents blackouts, by means of the UPS feature of generators.
• Energy suppliers save on peak power generation installation through an emergency power-
saving subsidiary.
• Housing construction companies can attain a competitive edge when bidding for contracts
that require CO
reduction and electric power saving.
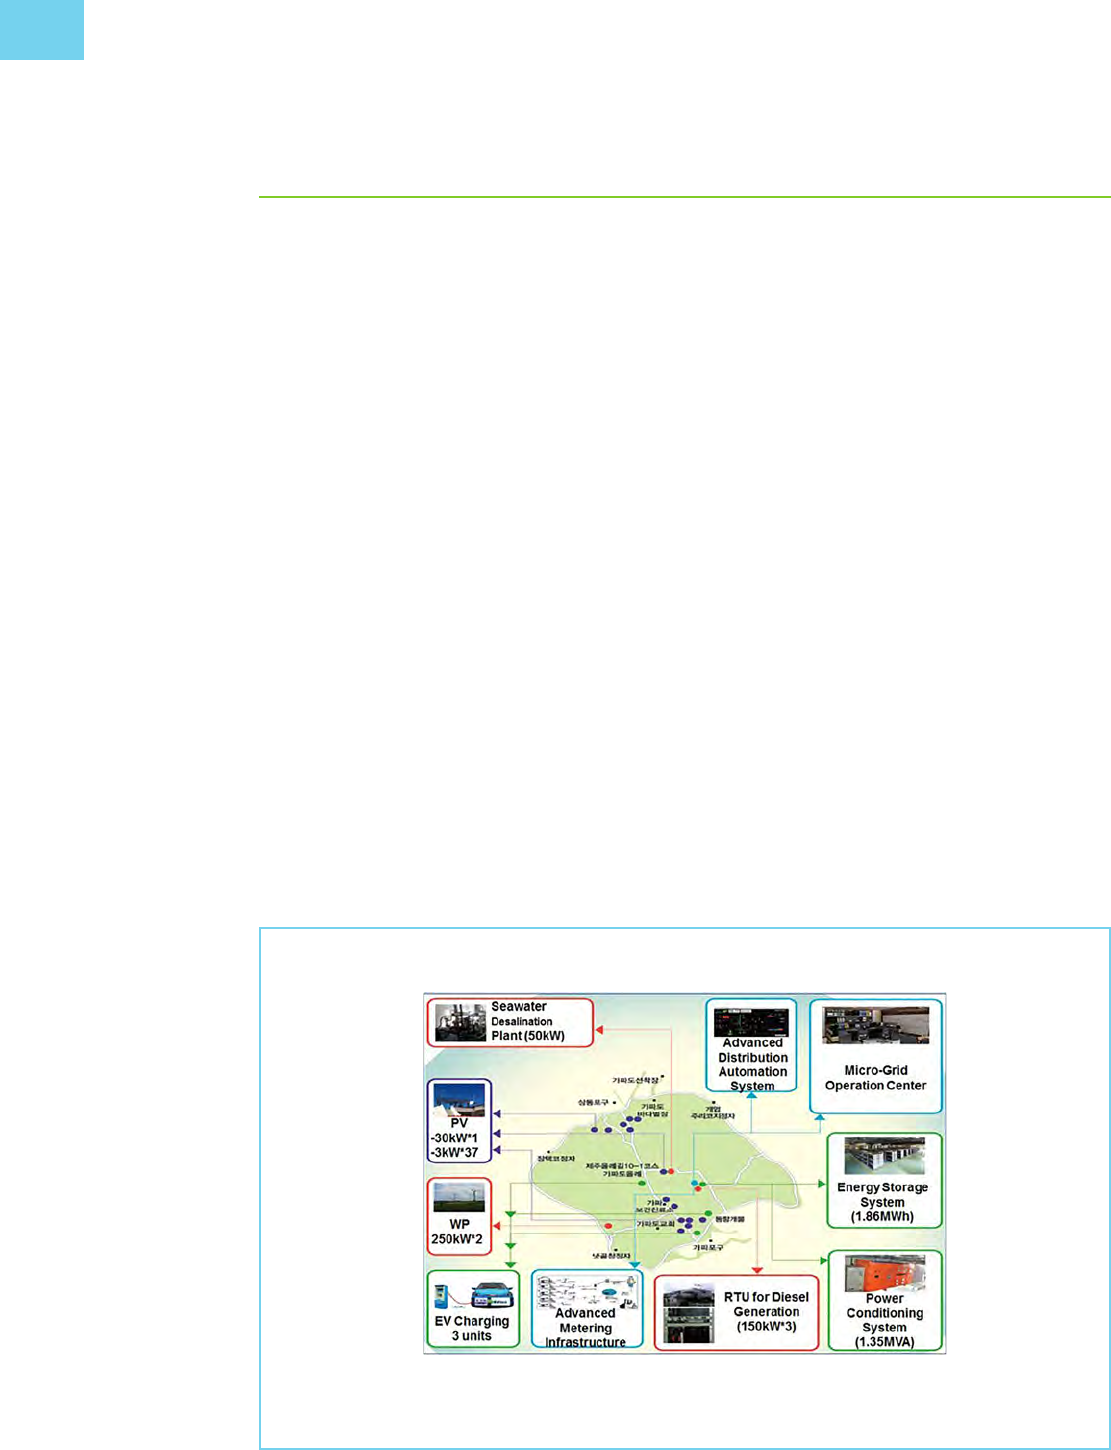
HANDBOOK ON BATTERY ENERGY STORAGE SYSTEM
. MICROGRIDS
Microgrids (Figure .) can be thought of as miniature electric power networks that can operate
independently or while connected to the larger utility grid. Microgrids connected to an external grid
are defined as interconnected loads and distributed energy resources within clearly defined electrical
boundaries that act as a single controllable entity.
Microgrids have traditionally been used in industry for the purposes of power quality enhancement
for critical loads and for cogeneration of heat and power. In recent times, microgrids using RESs
have increasingly been used to power remote communities. However, a downside to inverter-based
renewables is the lack of inertial response capability, which is the mechanical response of traditional
synchronous generators to abrupt changes in system frequency. Community microgrids using inverter-
based RESs are an important step toward energy security and sustainability.
Energy storage has many benefits for microgrids:
• providing ancillary services such as frequency regulation and voltage control, which are
essential for microgrid operation;
• enhancing the integration of distributed and renewable energy sources;
• storing energy for use during peak demand hours;
• enabling grid modernization;
• integrating multiple smart-grid technologies;
• meeting end-user needs by ensuring energy supply for critical loads, controlling power quality
and reliability at the local level; and
• promoting customer participation through demand-side management.
Figure . shows a typical microgrid installation on Jeju Island, Republic of Korea.
Figure .: Microgrid on Jeju Island, Republic of Korea
EV electric vehicle, kW kilowatt, MVA megavolt-ampere, MWh megawatt-hour, PV photovoltaic, RTU remote
terminal unit, Wp watt peak.
Source: Korea Battery Industry Association “Energy storage system technology and business model”.
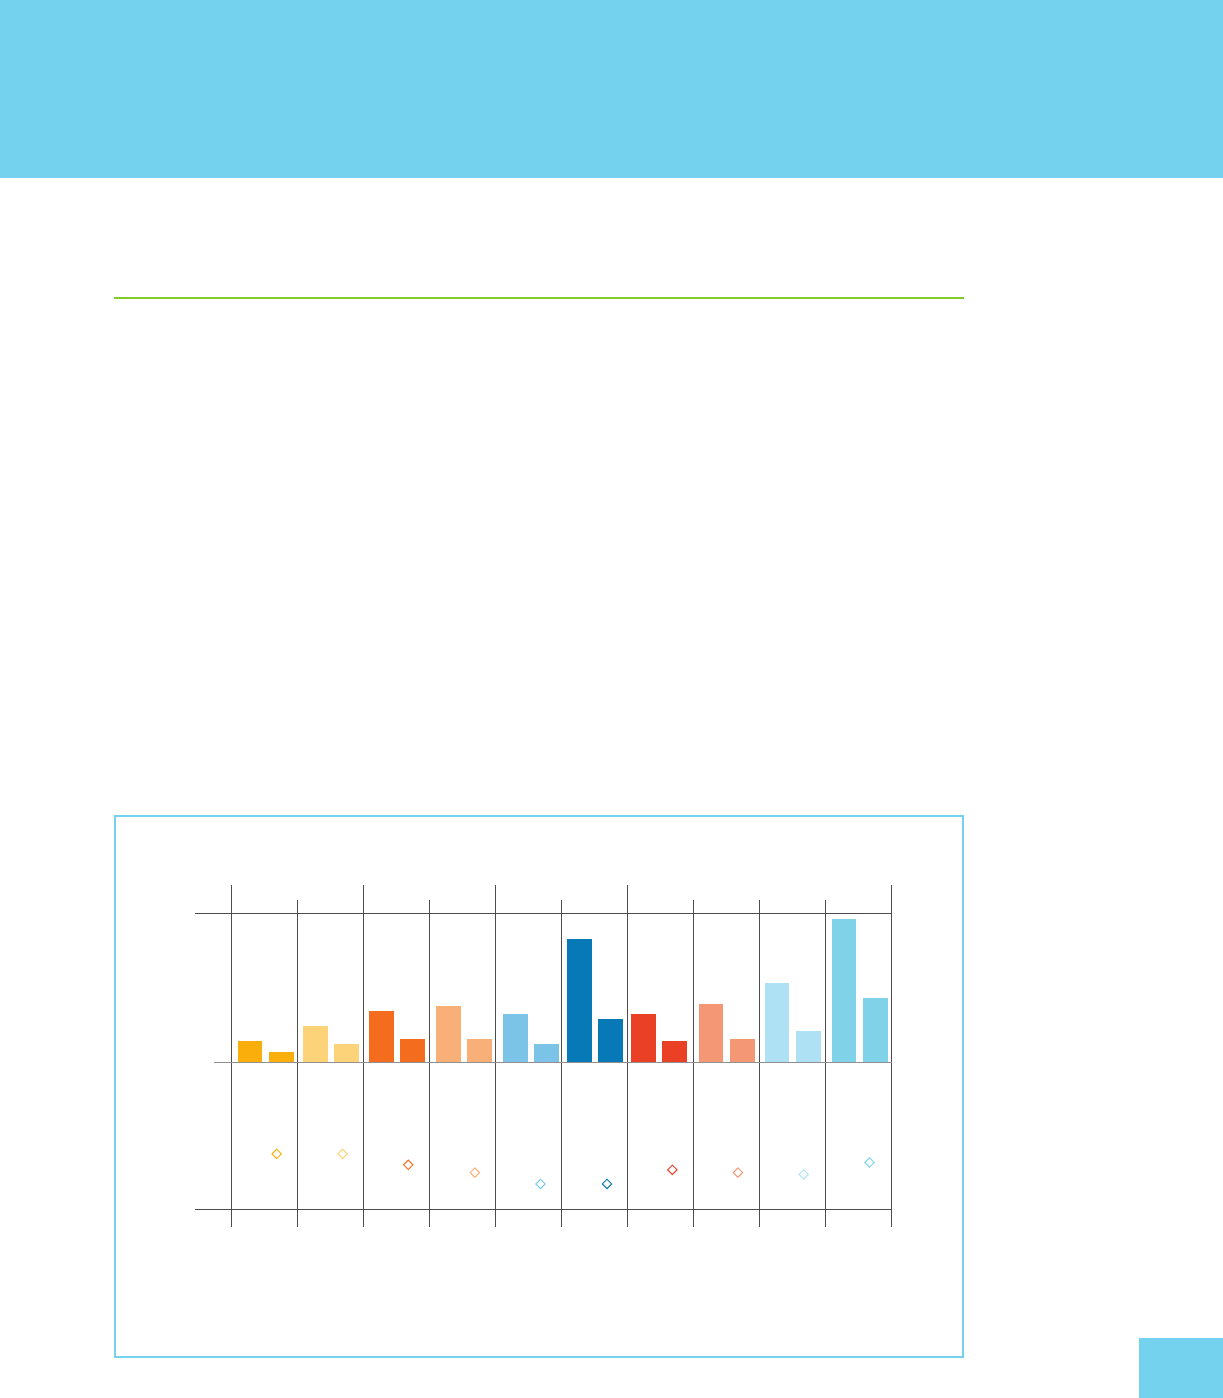
. GENERAL CHALLENGES
.. Cost Reduction
While many factors influence the growth of the ESS market, battery price is expected to have
considerable impact on the viability of a BESS project. In recent years, the price of batteries used in
BESSs has fallen rapidly. The price of lithium secondary batteries has dropped, from ,/kWh in
to /kWh in . The prices of other batteries are expected to fall by a further –
until (Figure .).
According to the distribution of ESS system development installation costs, the battery cell accounts
for ; power equipment, such as the BMS and the power conversion system (PCS), for ; and
the construction cost of distribution and communication facilities, for . As battery price makes
up a large portion of the project cost, the current price fallo provides an opportunity for mainstream
acceptance and use.
Battery prices are expected to drop even further in the future, and economies of scale can be realized
through independent technology, investment in research and development (R&D), and expansion of
productive capacity.
CHALLENGES AND RISKS
Figure .: Price Outlook for Various Energy Storage Systems and Technologies
2016 2030
–50%
–80%
–60%
–40%
–20%
Energy installation cost ($/kWh)
0%
0
500
1,000
Flooded La
Lead-acid High-temperature Flow
Li-ion
VRLA NaS NaNiCl VRFB ZBFB NCA NMC/LMO LFP LTO
–50%
–56%
–60%
–66% –66%
–59%
–60%
–61%
–54%
2016 2030 2016 2030 2016 2030 2016 2030 2016 2030 2016 2030 2016 2030 2016 2030 2016 2030
LA lead–acid, LFP lithium–iron–phosphate, LMO lithium–manganese oxide, LTO lithium–titanate, Na–NiCl
sodium–
nickel chloride, Na–S sodium–sulfur, NCA nickel–cobalt–aluminum oxide, NMC nickel–manganese–cobalt, VRFB
vanadium redox flow battery, VRLA valve-regulated lead–acid, ZBFB zinc–bromine flow battery.
Source: IRENA (). Electric Storage and Renewable : Cost and Markets to , IRENA,

HANDBOOK ON BATTERY ENERGY STORAGE SYSTEM
.. Deployment
ESSs can be used as power generation resources, in connection with the transmission and distribution
network or with renewable energy, or as demand-side resources.
Use as power generation resource. This refers to the use of the ESS as power supply resource, which
is the main role of power generators in existing power systems. In this role, the ESS can be used for
power supply transfer (under a contract for dierence) and for power supply capacity reinforcement.
Use in connection with transmission and distribution network. Unlike the use as power
generation resource, connection to the T&D network allows the ESS to support the T&D facilities and
provide temporary relief from distribution problems rather than supplying power continuously over an
extended period. Like the use as power generation resource, on the other hand, ESS use in connection
with the T&D network enables the supply or storage of the required power at the desired time through
the charge and discharge capabilities of the ESS.
Use in connection with renewable energy sources. Electricity generation from RESs is greatly
aected by natural conditions leading to variability and intermittence in the amount of power
generated and the power generation period. Large deviations in solar and wind-power production
from forecast volumes can put the stability of the power system at risk. An ESS can stabilize the power
supply by storing power when demand or forecast error is low, and releasing it when power demand or
forecast error is high.
Use as demand-side resource (for consumers). The use of the ESS for consumers is not very
dierent from other uses mentioned above. The main dierence among these various uses lies only
in the beneficiary. Using the ESS may reduce the energy cost for consumers and improve the quality,
service, and reliability of power (by providing a backup supply source).
.. Incentive Program
ESSs can help balance power demand and supply, thereby ensuring a stable power supply. Various
demonstration projects and businesses centering on ESSs have been carried out globally for purposes
such as reducing greenhouse-gas emissions and supporting aging power facilities.
The ESS market is still in its early stages, but it has been growing rapidly, mainly in Australia, Europe,
Japan, and the United States (US). Key factors behind this growth are the fall in battery prices,
improved stability of power systems, integration of alternative and renewable energy sources, and ESS
policy. These elements are also expected to influence the increase in demand for ESSs for assisting
power networks as power transmission and distribution costs rise with the aging of power networks.
At present, ESSs are still expensive, and the private sector is unlikely to take on large projects without
a very clear business case on account of the high cost of initial installation and continued investment
in battery cell replacement. However, some countries are making eorts to develop and supply ESS
technology to the global market by providing subsidies for ESS installation and providing exemptions
from related taxes. In some cases, governments are encouraging the private sector to participate in the
market by providing subsidies to ease the burden of initial installation on consumers.
Regarding the subsidy policy of dierent countries, Germany is shouldering of the installation
costs of solar power generation–related ESSs with an ESS installation subsidy. The scale of German

CHALLENGES AND RISKS
government support has increased, from million in to million between and ,
for a total of about million over years. Japan also provided billion yen in subsidies until in
order to develop the industrial ecosystem for ESSs with the goal of capturing of the global market
by . The US is urging power-market operators in each state to develop ESS-related business
models, and the Republic of Korea is supporting ESS market penetration by extending the application of
weighted value to new and renewable energy–related ESSs such as Photovoltaic . until .
.. United Nations Framework Convention
on Climate Change
The Paris Agreement, the new climate-change regime adopted by the United Nations Framework
Convention on Climate Change (UNFCCC) in , governs the climate change response from
onward.
It will replace the Kyoto Protocol, which expires in . While acknowledging the Intended
Nationally Determined Contributions (INDCs) already submitted by the dierent countries, the
agreement requires the submission of a higher goal every years starting in .
Developed countries have decided to provide at least billion (about trillion won) in support
every year from onward to help developing countries cope with climate change. Unlike the Kyoto
Protocol, which imposed the reduction obligation only on developed countries, this agreement is the
first to require compliance by all countries that ratified the UNFCCC.
To implement their commitments to reduce greenhouse gas emissions, the countries could introduce
new and renewable energy in the power area and increase energy eciency by promoting the wider-
scale adoption of energy storage devices, to supplement variable new and renewable energy sources.
The Asian Development Bank (ADB) has raised million to help finance climate change
mitigation and adaptation projects with the issue of a -year green bond. In July , ADB adopted its
Climate Change Operational Framework –. The framework strengthens ADB’s support for
compliance by its member countries with their climate commitments under the Paris Agreement, the
Sustainable Development Goals, and the Sendai Framework for Disaster Risk Reduction –,
including their INDC pledges to reduce greenhouse-gas emissions.
ADB’s climate mitigation and adaptation financing reached a record . billion in , a increase
over the previous year’s figure. ADB is now in a position to achieve its billion annual climate
financing target by . Of this amount, billion will be dedicated to mitigation through scaled-up
support for renewable energy, energy eciency, sustainable transport, and the building of smart cities,
while billion will be for adaptation through more resilient infrastructure, climate-smart agriculture,
and better preparedness for climate-related disasters.
The st Conference of the Parties (COP) of the UNFCCC held in Paris, France, from November (local time), finally
adopted the Paris Agreement on December, after weeks of negotiation.

HANDBOOK ON BATTERY ENERGY STORAGE SYSTEM
. GENERAL RISKS
.. Poorly Defined and Categorized Systems
ESS technologies are being actively developed and demonstrated around the globe. The ESS industry
is receiving a tremendous boost from the increased integration of RESs into electric power systems. As
the industry expands, defining and standardizing the terminology will become increasingly important.
Dierent terms are used in relation to ESSs in dierent countries and dierent fields of application
(e.g., “ESS,” “EES,” “BESS”). Japan uses the term “electrical storage systems” in its technology standards
and guidelines for electrical equipment to refer to electromechanical devices that store electricity.
In the case of the US, the equivalent term is “rechargeable energy storage systems,” defined in its
National Electrical Code (NEC). In the Republic of Korea, while the term “electrical storage systems”
can be found in its electrical equipment technology standards, what is mentioned in the standards
established by the International Electrotechnical Commission (IEC) and adopted by the country are
“electrical energy storage systems.” The IEC standards define unit parameters and testing methods,
and deal with planning, installation, safety, and environmental issues.
Setting standards to unify the unclear and vague terminology will improve technical communication
between countries and institutions.
.. Unbundling of Operation and Network
Development Activities
Unbundling rules restrict the ability of network operators (TSOs and distribution system operators)
to engage in activities other than network operation. Such restrictions apply in particular to the
management of power generation assets. The applicability of unbundling rules to EES is unclear at
present and will depend on how storage is defined and categorized. In Europe, this matter needs to be
decided primarily at the European Union (EU) level to ensure uniform application in all member states.
Until this matter is clarified, regulatory uncertainty will remain. Classifying EES as a generation asset
would make it more dicult for a network operator to have control over a storage project.
At present, there are diering views as to the necessity of applying the unbundling regime to EES.
Since network operators could be important stakeholders in EES project development, and EES
may contribute to resolving balancing issues cost-eciently, one could argue that the regulatory
framework should allow the participation of network operators in EES activities. But appropriate
regulatory safeguards must be introduced to avoid undue distortions in competition resulting from the
monopolistic position of network operators.
.. Grid Tari Applications and Licensing Issues
ESSs store generated electricity using lithium-ion batteries and release the stored electricity when
needed. Because of their high eectiveness in expanding the use of renewable energy and improving
the eciency of the power industry, ESSs can have a wide range of uses to power systems (suppliers)
and users (consumers). The variability of renewable energy generation depending on climate
conditions gives rise to the issue of concentrated power generation. The ability to store and manage
electric power makes it possible to resolve variable generation and output concentration issues to

CHALLENGES AND RISKS
a considerable degree. It also enables output regulation according to demand, thus reducing power
consumption deviation (peak demand burden) per time period. ESS is therefore used to lessen
problems with eciency such as excess generation and excess facilities. Accordingly, power systems
can use ESS to adjust frequency and to stabilize the output of renewable energy generators; users can
use it to reduce peak power and lower fees or to sell surplus power according to policies.
In the Republic of Korea, an ESS powerhouse, policies are in place to procure a certain level of profits
when installing and operating ESSs to reduce peak demand or when linking with solar power or wind
power generation by the private sector to expand ESS distribution and improve the eciency of the
renewable energy and electric power industry. Profits from power generation comprise power sales
profits and renewable energy certificate (REC) profits. When ESS is installed in wind power and solar
power generation, and even if the same amount of energy is generated, support is oered to boost REC
profits .–. times higher. Therefore, small-scale investments are possible, and demand to combine
ESS mainly with solar power generation, which has high support benefits, continues to grow. The basic
concept of peak demand reduction is dierence transaction—using the dierence in electricity fees
per time period. Even if the same amount of electricity is used during the day, the peak load drops, thus
lowering the base fee and the average cost of electricity. As ESS special fees will be applied until ,
installing MWh ESS for industrial use can save directly about million won in electricity fees.
If industrial electric fees are raised in the future, ESS demand for reducing peak demand is likely to grow
mainly among manufacturers with high power usage.
.. Battery Safety
Among secondary batteries, lithium secondary batteries are the power source for the age in which
mobile electronic devices have become commonplace. With application being expanded to industrial
sectors such as battery electric vehicles (BEVs) and ESSs, R&D is being conducted on measures to
ensure safety, such as lowering heating and ignition incidents resulting from the high density of lithium
secondary batteries.
Lithium secondary batteries contain both oxidizers (negative) and fuel (positive) within the enclosed
battery space, and therefore also carry the risk of fire and explosion in case of overcharging, over-
discharging, excess current, or short circuits (Figure .). For battery safety, safety design is essential at
the cell, module, pack, and final product level. If safety fails at one level, more severe accidents at the
higher levels can quickly follow. There is no single standard or parameter for assessing battery safety.
A battery protection circuit will improve safety by making such accidents less likely or by minimizing
their severity when they do occur.
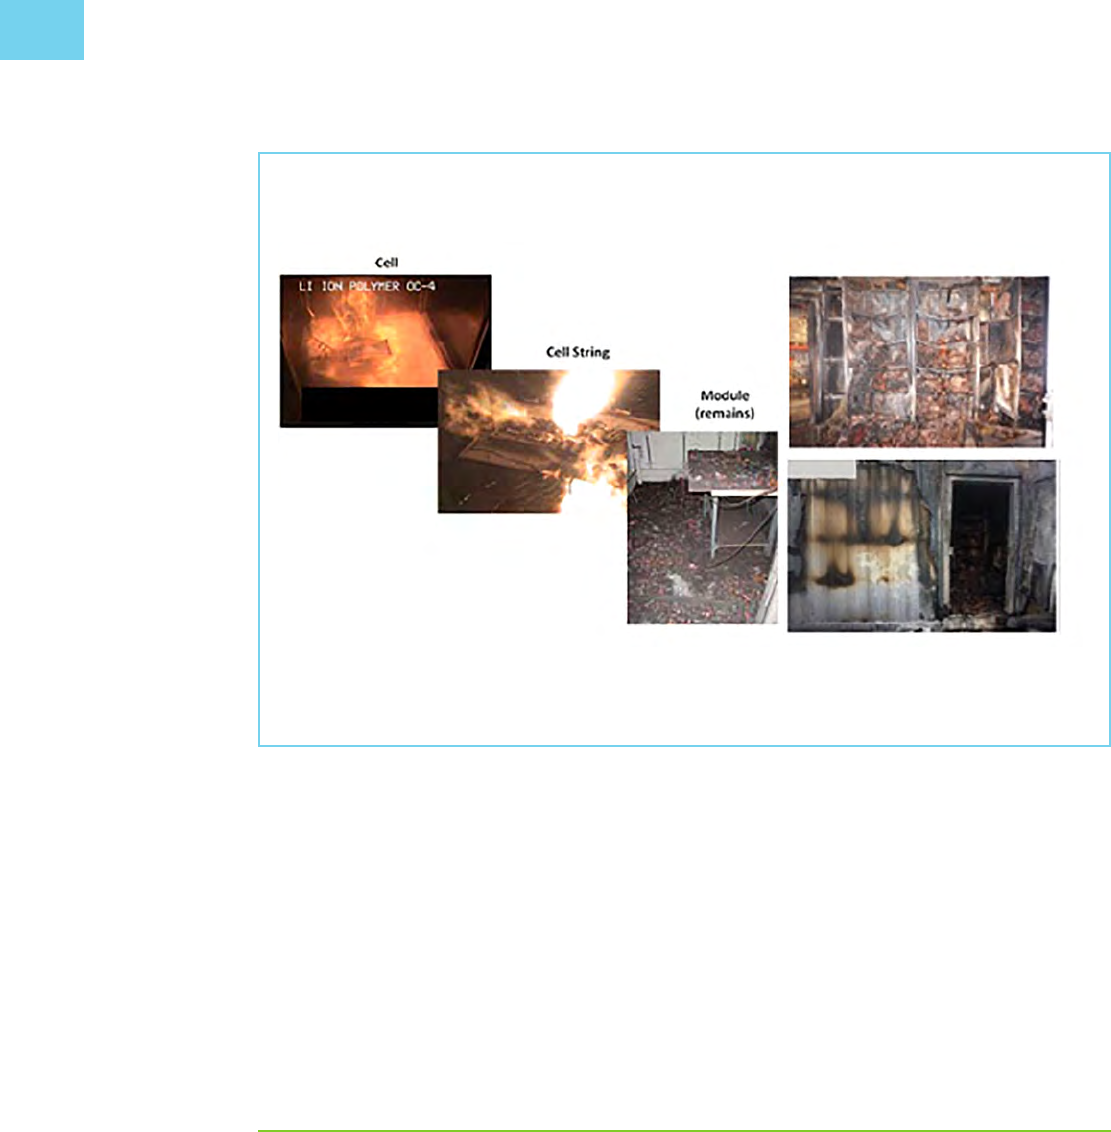
HANDBOOK ON BATTERY ENERGY STORAGE SYSTEM
Protection devices are integrated into the cell, module, and battery systems to prevent abnormalities
and cut down on accidents. Current interrupt devices (CIDs), positive temperature coecient (PTC)
thermistors, current-limiting fuses, diodes, battery management systems (BMSs), etc., control the
occurrence and intensity of heat and gas. Moreover, the need for fire suppression systems is getting
increasing attention as plans are made to reduce the severity of accidents.
However, there are currently no standards or test criteria for fire prevention systems design. In the
US, testing of such systems is in its initial phases, and the Fire Protection Research Foundation, an
aliate of the nonprofit National Fire Protection Association (NFPA), is winding up research on fire
suppression, including risk management of lithium secondary batteries and sprinkler design.
. CHALLENGES OF REDUCING CARBON EMISSIONS
The impact on CO
emissions of electrical storage systems in power systems with high penetrations of
wind generation, such as the Irish power system, can be used as an example. The observed dispatch of
each large generator in – was used to estimate a marginal emission factor of . kgCO
/
kWh (McKenna, Barton, and Thomson ).
Selected storage operation scenarios were used to estimate storage emission factors—the carbon
emission impact associated with each unit of storage energy used. This value is substantially higher
than the estimated average emission factor for the same period (. kgCO
/kWh), highlighting
the potential to underestimate the impact of demand-side interventions if the lower value is used
incorrectly. With the aim of estimating the short-run in-use environmental impact of electricity storage
Figure .: Magnified Photos of Fires in Cells, Cell Strings, Modules,
and Energy Storage Systems
E. P. R. Dan Doughty, Electrochem Soc, vol. Voulme , no. Issue , pp. -, .
ESS energy storage system.
Source: Doughty and Roth ().

CHALLENGES AND RISKS
in the Irish power system, marginal emission data were filtered according to various storage operation
scenarios to estimate marginal emission factors for storage charging and discharging. These were
combined with storage round-trip eciency to provide an estimate of the “storage emission factor”—
the carbon emission impact associated with each unit of energy delivered from storage.
CO
2
reduction (TOE) = ESS capacity [MW]
*
usage
[
h
]
y
* useful life [y]
*
0.5642
[
TOE
]
MWh
e.g. MW
*
h
d
*
365
d
y
*
y
*
.
TOE
MWh
,, TOE
CO carbon dioxide, d day, ESS energy storage system, h hour, MW megawatt, MWh megawatt-hour, TOE metric tons of
oil equivalent, y year.
Table . lists the various energy storage applications together with their emission reduction potential.
Table .: Energy Storage Services and Emission Reduction
Category Service
Potential
for Emission
Reduction Nature of Direct Emission Reduction
Bulk energy services Electric energy time
shift (arbitrage)
Yes If energy storage avoids or reduces curtailment,
additional emission reductions can be made to the
extent that the additional renewables displace higher
emission sources of generation. Where a renewable
generator is able to shift grid output from one time
period to another, higher or lower emission reduction
may result, depending on the dierence between the
grid-emission factors at the time of dispatch.
Electric supply
capacity
Yes To the extent that energy storage technologies
allow higher levels of renewable-energy generation,
additional emission reductions are possible.
Ancillary services Frequency regulation Maybe Where energy storage technologies can replace
frequency regulation services traditionally provided
by fossil fuel generators, there may be potential for
reducing emissions. This depends on the source
of the power used to charge the energy storage
system, which is then used periodically for frequency
regulation services.
Spinning, non-
spinning, and
supplemental
reserves
Maybe As above, potential for emission reduction depends
on the source of the power used to charge the energy
storage system.
Voltage support Maybe As above
Black start Maybe As above
Transmission
infrastructure
services
Transmission
upgrade deferral
Maybe Depends on analysis of various options and source of
power used to charge the energy storage system.
Transmission
congestion relief
Yes Where energy storage technologies can help avoid
the curtailment of renewable energy sources due
to transmission congestion, there is potential for
contribution to emission reduction.
continued on next page

HANDBOOK ON BATTERY ENERGY STORAGE SYSTEM
Category Service
Potential
for Emission
Reduction Nature of Direct Emission Reduction
Distribution
infrastructure
services
Distribution upgrade
deferral
Maybe Depends on analysis of various options and source of
power used to charge energy storage system.
Voltage support Maybe As above. Potential for emission reduction depends
on the source of the power used to charge the energy
storage system.
Customer energy
management
services
(residential, and
C&I)
Power quality Maybe As above
Power reliability Maybe As above
Retail electric energy
time shift
Maybe Time shifting—using the energy storage system when
grid emission intensity is low and discharging when
grid emission intensity is higher—oers potential for
additional emission reduction.
Demand charge
management
Maybe Demand charge management is a form of time
shifting and so, as above, the potential for emission
reduction depends on the source of the power used
to charge the energy storage system.
Increased self-
consumption of solar
PV
Maybe If the availability of energy storage leads households
to install larger solar PV systems, there could be
additional emission reduction. Otherwise, time
shifting by itself will not in itself reduce emissions.
O-grid Solar home system Yes Where o-grid energy storage systems replace
biomass or fossil fuel alternatives, emission reduction
will be possible.
Mini-grids: System
stability services
Yes As above
Mini-grids:
Facilitation of high
share of variable
renewable energy
Yes As above
Transport sector Transport applications of energy storage are not a focus of this program
C&I commercial and industrial, PV photovoltaic.
Source: ADB, based on IRENA taxonomy of energy storage services.
. BATTERY RECYCLING AND REUSE RISKS
Battery reuse (Figure .) is defined under Article . of the EU’s Waste Framework Directive
//EC as any operation that calls for using batteries again for the same purpose for which
they were originally designed. One could argue that any reuse of batteries—a system component—
must occur in the original application in order for all technical performance and safety aspects to be
secured. This is also indicated in the End-of-Life Vehicles Directive //EC, Article ., of the
EU, which defines reuse as any operation in which components of end-of life vehicles are used for the
same purpose for which they were conceived.
Table . continued
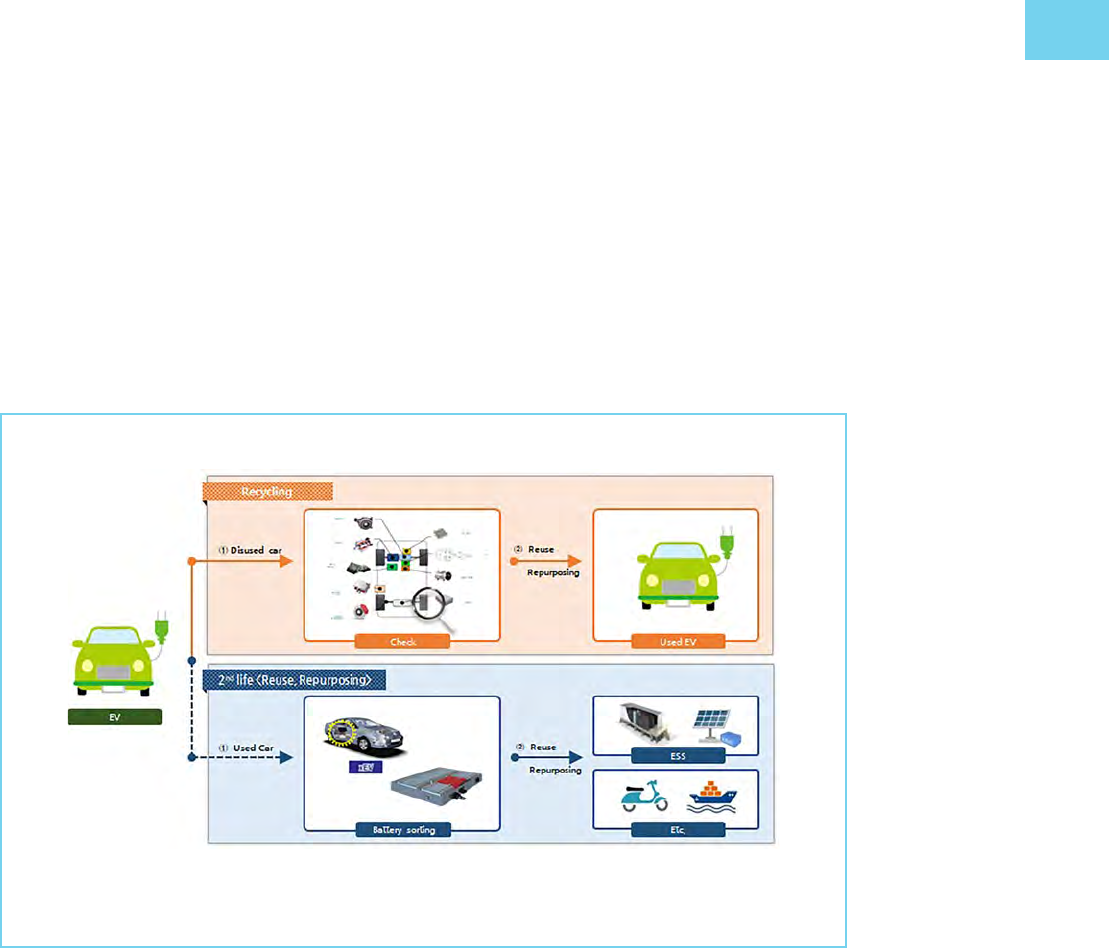
CHALLENGES AND RISKS
Battery recycling is aimed at reducing the number of batteries disposed of as municipal solid waste. It
is the best approach to end-of-life management of spent batteries, mainly for environmental, but also
for resource conservation and economic reasons.
Battery recycling plants require the sorting of batteries according to their chemistry. Some sorting
must be done before the batteries arrive at the recycling plant. Nickel–cadmium, nickel–metal hydride,
lithium-ion, and lead–acid batteries are placed in designated boxes at the collection point. Battery
recyclers claim that if a steady stream of batteries, sorted by chemistry, were made available at no
charge, recycling would be profitable. But preparation and transportation add to the cost.
Figure .: Second-Life Process for Electric Vehicle Batteries
ESS electric storage system, EV electric vehicle.
Source: Korea Battery Industry Association “Energy storage system technology and business model”.
.. Examples of Battery Reuse and Recycling
General Motors used-battery electric storage system project with ABB. Used Chevrolet Volt
batteries are helping keep the lights on at the new General Motors (GM) Enterprise Data Center at
GM’s Milford Proving Ground in the US state of Michigan.
Figure . shows a microgrid backup system powered by five used Chevrolet Volt batteries—the result
of collaboration between GM and Swiss power engineering firm ABB.
BMW used-battery electric storage system project with Bosch. Electro-mobility and power
storage are two core elements of the move to alternative forms of energy. A project is bringing
the German-based multinational engineering and electronics company Bosch together with the
BMW Group and Swedish power company Vattenfall to drive progress on both technologies by
interconnecting used batteries from electric vehicles to form a large-scale ESS in Hamburg. The energy
produced, available within seconds, can help keep the power grid stable.
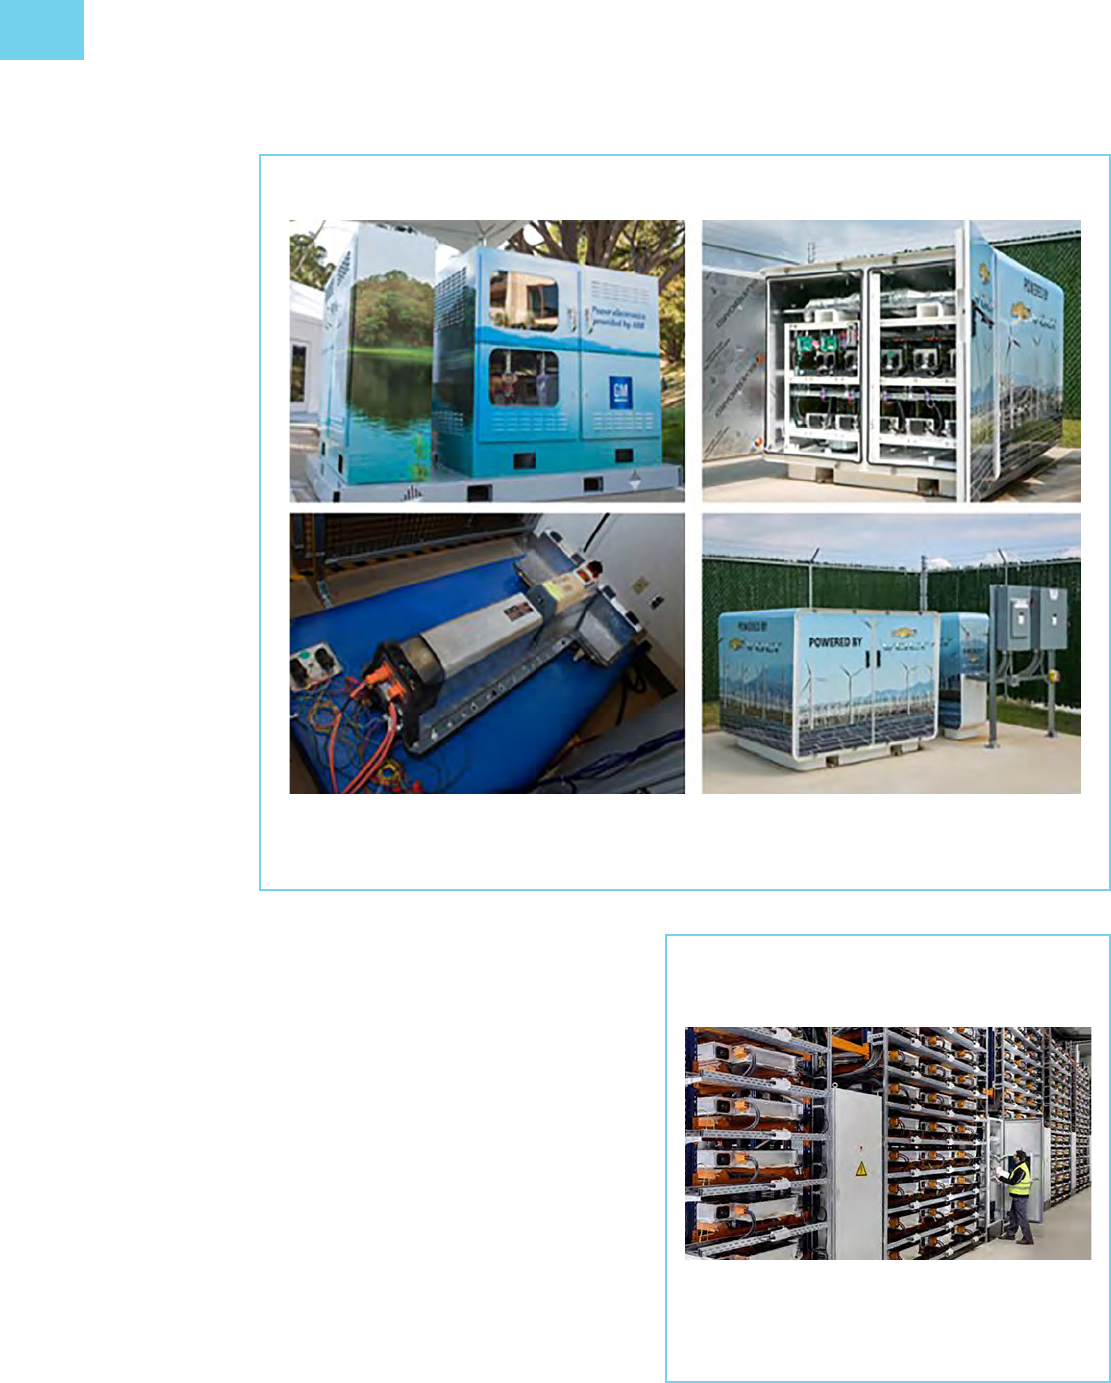
HANDBOOK ON BATTERY ENERGY STORAGE SYSTEM
Figure .: GM–ABB Second-Life Electric Vehicle Battery Applications
Source: Charged Electric Vehicles Magazine, “Nissan, GM and Toyota repurpose used EV batteries for stationary storage,”
Gharged Electric Vehicles Magazine, . [Online]. Available: https://chargedevs.com/newswire/nissan-gm-and-toyota-
repurpose-used-ev-batteries-for-stationary-storage/. Morris ().
Li-ion batteries still have high storage
capacity at the end of their life cycle in
electric vehicles. For this reason, they are
still very valuable and can be used extremely
eciently as stationary buer storage for
many more years (Figure .). The project
allows the three partners to gain many new
insights into potential areas of application
for such batteries, their aging behavior, and
their storage capacity. Bosch’s management
algorithm is applied to ensure maximum
service life and performance, as well as other
benefits (Figure .).
Renault used-battery project with
Powervault. Automakers like Renault have
introduced a new business model within
the framework of battery pack reusability.
In this model, the battery pack is leased to
the vehicle owner, while actual ownership
Figure .: Second-Life Energy Storage
Application for BMW Electric Vehicle Batteries
Source: Chris Davies. BMW’s battery graveyard gives EV
cast-os a second life, October . https://www.slashgear.
com/bmws-battery-graveyard-gives-ev-cast-os-a-second-
life-/
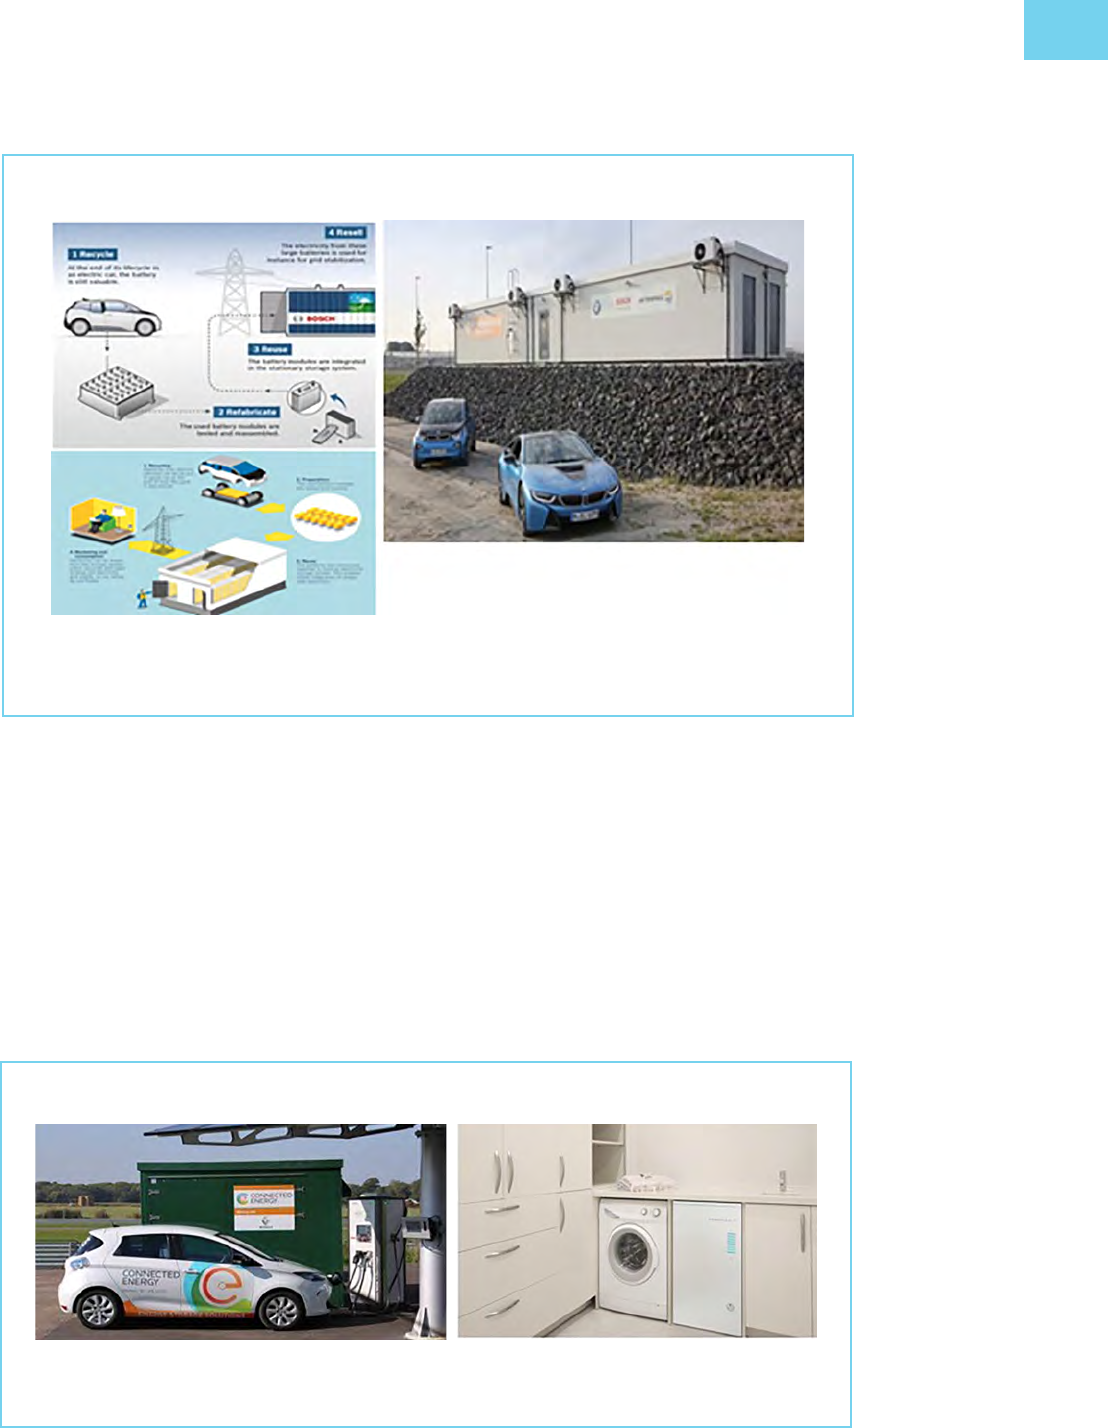
CHALLENGES AND RISKS
Figure .: BMW–Bosch Second-Life Electric Vehicle Battery Demonstration Project
Source: M. KANE, “Bosch Cooperates With BMW And Vattenfall In Second Life Battery Project,” Inside EVs, . [Online].
Available: https://insideevs.com/bosch-cooperates-with-bmw-and-vattenfall-in-second-life-battery-project/. Kane ().
is retained by the manufacturer. When these battery packs reach the end of their operational life,
the automaker replaces them with new battery packs at a fraction of the cost of the actual battery.
Two new energy storage units made by Connected Energy of the UK use old Renault electric vehicle
batteries, and were recently installed at fast-charging stations on highways in Belgium and Germany.
Renault and London-based Powervault, manufacturer of home ESSs, have announced a partnership
to promote the reuse of Renault electric vehicle batteries for home energy storage units, thus reducing
the cost of a Powervault smart battery unit by (Figure .). The partnership kicked o with a year-
long trial of units installed in solar-powered homes in the UK. During the trial, which began in July
, system performance was monitored and customer reaction ascertained. The results of the trial
will help in the preparation of a rollout strategy for general release.
Figure .: Renault–Powervault’s Second-Life Electric Vehicle Battery Application
Source: M. KANE, “Renault To Enter Home Battery Market With Repurposed EV Batteries,” InsedEVs, . [Online].
Available: https://insideevs.com/renault-repurposed-ev-batteries-ess/. Kane ().
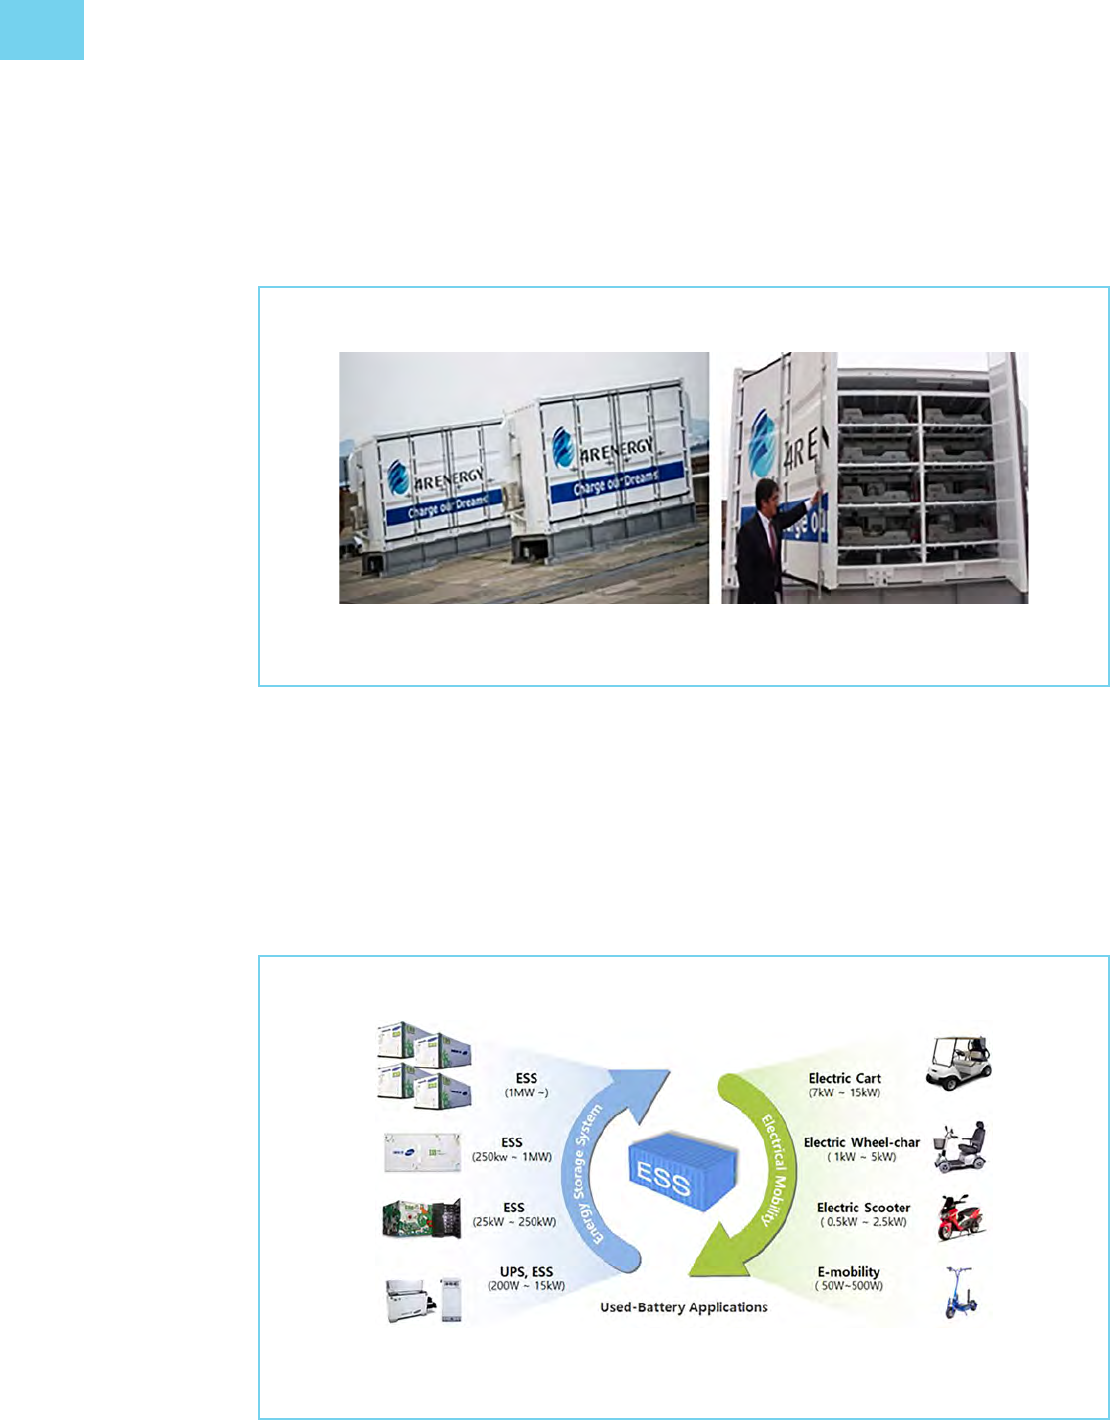
HANDBOOK ON BATTERY ENERGY STORAGE SYSTEM
Nissan used-battery ESS project with 4R Energy. A joint venture between Sumitomo and Nissan
called R Energy—“R” stands for “Reuse, Resell, Refabricate, and Recycle”—uses lithium-ion
batteries from electric vehicles to help monitor energy fluctuations and store the solar farm’s energy
output (Figure .).
The human-made island of Yumeshima in Osaka, western Japan, is now home to the world’s first large-
scale energy storage system, highlighting the potential for reusing electric vehicle batteries.
.. Reuse of Electric Vehicle Batteries for Energy Storage
The end-of-life (EOL) of a battery is around of initial capacity. However, even at capacity,
the battery can be used for – more years in ESSs (Figures . and .).
Figure .: Nissan–Sumitomo Electric Vehicle Battery Reuse Application (R Energy)
Source: Jim (). Jim, “Used Nissan EV Batteries Now Provide Grid Scale Storage,” Vehicle to Grid UK, . [Online].
Available: http://www.vg.co.uk///used-nissan-ev-batteries-now-provide-grid-scale-storage/.
Figure .: Reuse of Electric Vehicle Batteries In Energy Storage Systems
ESS energy storage system, kW kilowatt, MW megawatt, UPS uninterruptible power supply, W watt.
Source: Korea Battery Industry Association “Energy storage system technology and business model”.
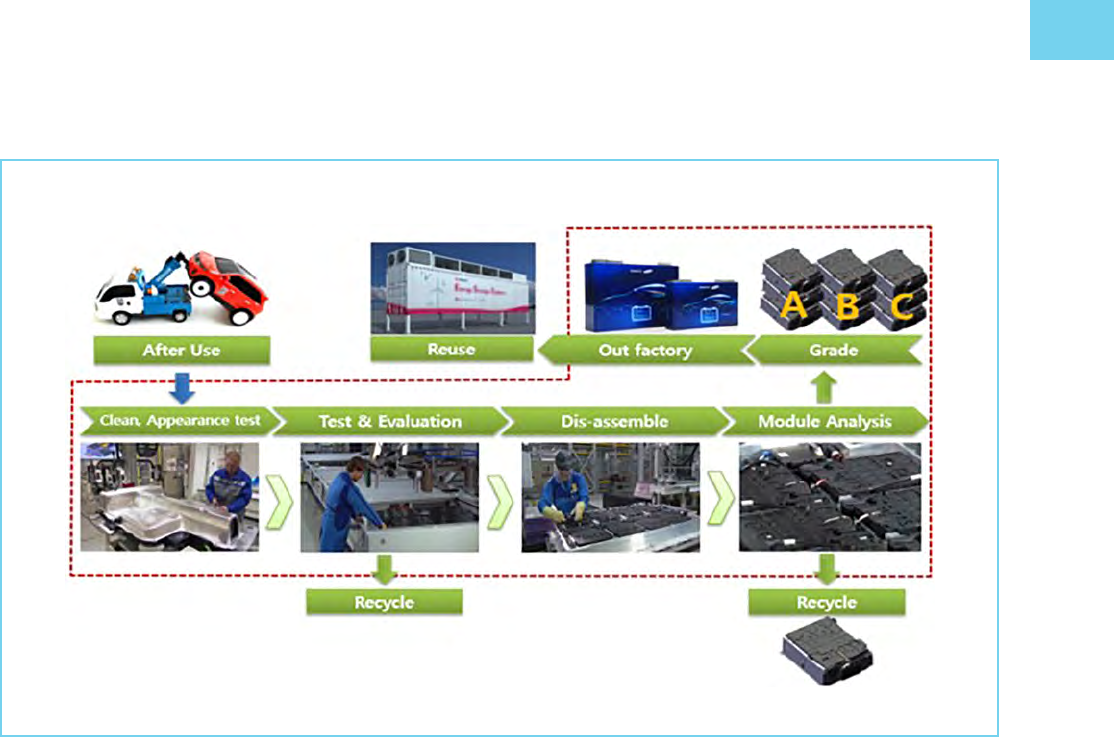
CHALLENGES AND RISKS
Figure .: Second-Life Electric Vehicle Battery Applications
Source: Korea Battery Industry Association “Energy storage system technology and business model.
.. Recycling Process
The recycling process starts by removing combustible materials, such as plastic insulation, with a gas-
fired thermal oxidizer. Gases from the thermal oxidizer are sent to the plant’s scrubber, where they are
neutralized to remove pollutants. The process leaves the clean, naked cells, which contain valuable
metal content. The cells are then chopped into small pieces, which are heated until the metal liquefies.
Non-metallic substances are burned o, leaving a black slag on top that is removed with a slag arm.
The dierent alloys settle according to their weight and are skimmed o like cream from raw milk.
Li-ion batteries are currently reprocessed through pyrolysis (heat treatment), with the metal content
as primary recovery. Zinc–carbon and/or air and alkaline–manganese batteries can be reprocessed
using dierent methods, including smelting and other thermal–metallurgical processes to recover the
metal content (particularly zinc). The processing method includes purification and separation through
hydrometallurgy processing after physical pretreatment. Hydrometallurgical processing involves
dissolving the spent lithium-ion batteries and then selectively separating them from the leach liquor,
which is then purified to obtain the required valuable metals. Through crushing and shredding, the
usual pretreatment operations in hydrometallurgical processing, the materials are easily liberated.
Most processing plants therefore use a combination of hydrometallurgical and mechanical processing
(Figure .).

HANDBOOK ON BATTERY ENERGY STORAGE SYSTEM
Figure .: Lithium-Ion Battery Recycling Process
Sourcing raw materials on domestic overseas
Purification and Separation by solvent
extraction
Collect
Physical
Treatment
Chemical
Separation and
Purification
Materialization
Hydrometallurgy process
• Easy variation of material change
• High recovery rate
• Recover Co. Ni. Mn. Li
• Low equipment cost
• Low Energy consumption
Hydro metallurgical Treatment
Co Ni
M
n
Li
Co cobalt, Li lithium, Mn manganese, Ni nickel.
Source: Korea Battery Industry Association “Energy storage system technology and business model”.
Chemical treatment process (hydro-process). The chemical recycling process applied to lithium
batteries and the materials resulting from the process are shown in Figure ..
Physical separation and purification of cathode active material. Discharged Li-ion batteries are
placed in an inert, dry atmosphere for mechanical crushing and shredding. This reduces the impact of
internal short circuits when in contact with oxygen, and avoids exposing the materials to water vapor,
which would hydrolyze the electrolyte.
Figure .: Chemical Recycling of Lithium Batteries, and the Resulting Materials
CoSO
• H
O cobalt sulfate heptahydrate, MnSO
• H
O manganese sulfate hydrate, Ni nickel, NiSO
• H
O nickel
sulfate hexahydrate.
Source: Korea Battery Industry Association “Energy storage system technology and business model”.
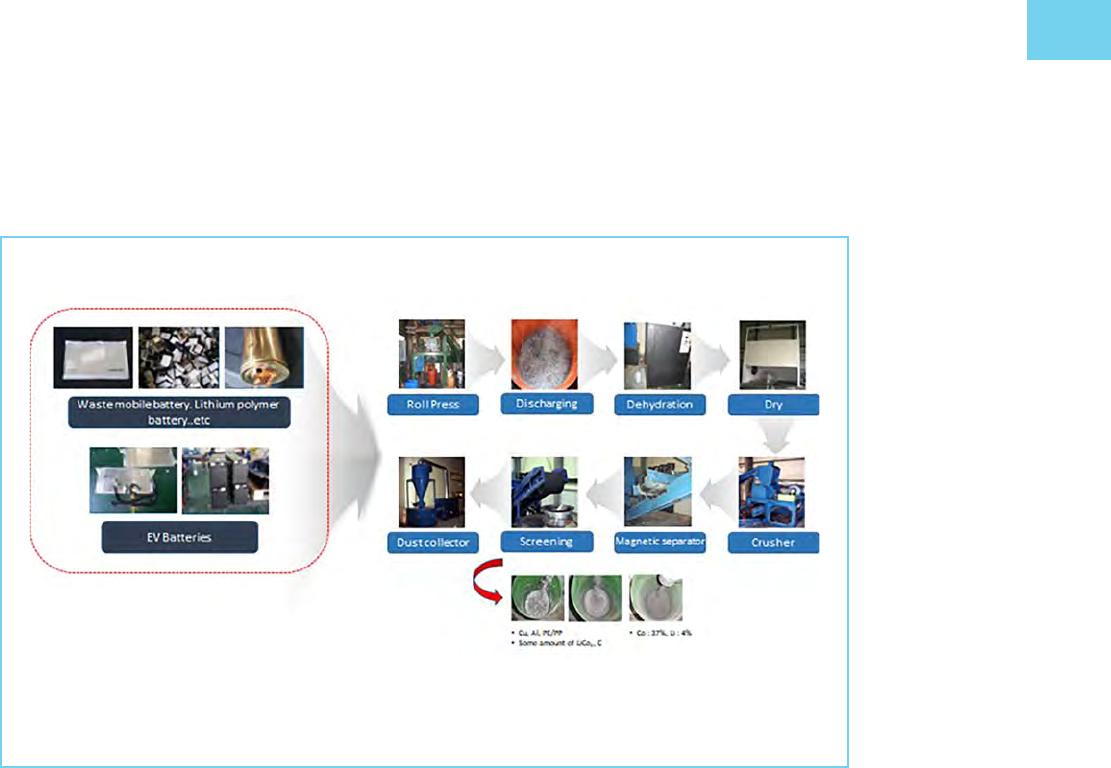
CHALLENGES AND RISKS
Plastics packaging is set apart for recycling, while electrodes and electrolytes undergo further
processing (Figure .).
Figure .: Physical Recycling of Lithium Batteries, and the Resulting Materials
Al aluminum, C carbon, Co cobalt, Cu copper, EV electric vehicle, Li lithium, LiCO
lithium ion, PE/PP
polyethylene/polypropylene.
Source: Korea Battery Industry Association “Energy storage system technology and business model”.

The business case for the installation of both large-scale and small-scale battery energy storage
requires supportive energy policies. Recommendations for select use cases are provided below.
. FREQUENCY REGULATION
Responsibility for frequency regulation is almost always assigned to the TSO of the synchronous
control area. BESSs have proven to be technically capable of delivering frequency regulation. In fact,
the response time of a BESS (in sub-seconds) is much faster than that of a conventional power plant
(typically – seconds). Therefore, energy policy should reflect the technical capabilities of various
asset types including BESS for use in frequency regulation.
Policy recommendations. The policy recommendations pertaining to frequency regulation are as
follows:
Update the grid code to allow for the delivery of frequency regulation by means of various generation,
load, and storage configurations.
Create market instruments that capitalize on the fast response time of batteries. For example, the
National Grid ESO has created a new service known as enhanced frequency response (EFR), which
requires faster ramp rates and response times to reflect the enhanced capabilities of BESS in frequency
regulation. In Germany, the regulator has relaxed the bidding criteria to increase the participation of
BESS and other asset types in existing ancillary service markets.
Enable smaller participants such as BESS operators and “prosumers” (producers–consumers) to oer
ancillary services by reducing the minimum bid size (MW) and volume of available energy (MWh).
For example, the German regulator has changed secondary reserve procurement from weekly to daily
delivery.
. RENEWABLE INTEGRATION
.. Distribution Grids
The major challenge presented by grid integration of renewable energy sources is cost recovery of
network investment. In most countries, the regulatory framework incentivizes network operators to
size networks according to peak capacity. In some countries where renewable energy sources are
guaranteed grid access, curtailment of renewable energy due to insucient grid capacity can lead
to fines and penalties for the network operator. However, cost recovery of network investments is
POLICY RECOMMENDATIONS

POLICY RECOMMENDATIONS
achieved mostly, if not entirely, from consumers through use-of-system charges. The burden of
network expansion related to grid-integration of RES therefore falls on consumers.
Another significant challenge that can be addressed with BESS is managing power quality in
distribution networks. Traditionally, the feeder voltage in the substation would be kept close to
the upper voltage tolerance limit to enable sucient voltage drops (as power is consumed) for all
consumers along the length of the feeder. However, with the rise of the prosumer, network operators
must be vigilant against increases in voltage during peak solar hours or on weekends, when solar supply
exceeds electricity consumption.
Distribution grid operations can be improved by means of a BESS:
Network congestion. In locations where network capacity is limited during peak renewable-
generation hours, a BESS can store the excess energy and release it into the network when renewable
generation reduces.
Power quality. A BESS can be used to absorb the supply of renewable energy and keep the voltage
below the upper limit prescribed in the grid code. The BESS can be either a grid-tied or a behind-the-
meter installation.
.. Transmission Grids
For transmission network operators, a key concern arising from the integration of renewable energy
sources is the eect of the variability and intermittence of generation. The various problems created,
such as the following, can be addressed with the help of BESS:
Forecast errors. Some degree of forecast error is always likely because of the variability of renewable
energy sources. To mitigate the risk of a large unexpected deviation from the forecast production of
renewable energy, the TSO is forced to increase its operational reserves. In such cases, a BESS can
reduce the forecast error by smoothing the energy entering the electricity network, thereby reducing
the forecast error.
Network congestion. High volumes of RES generation can sometimes lead to network congestion.
The TSO is then forced to re-dispatch—change the dispatch level of some power plants from the
least-cost result of the unit commitment algorithm—because of network constraints. The only other
option would be to curtail RES generation. The increased cost burden in both instances falls on the
consumer. In such cases, a BESS can store energy during periods of network congestion, thereby
reducing the need for RES curtailment or power plant re-dispatch.
Increased ramping requirements during evening peak hours. To deal with the increase in ramping
requirements, a BESS can store energy during a period of high renewable-energy production, e.g. solar
peak hours, and release it into the grid during o-peak production hours, e.g., during the evening hours,
when solar production drops o and the evening peak demand increases.
Policy recommendations. The following recommendations are aimed at dealing with the problems of
grid transmission:
Create regulatory frameworks that encourage the use of ESSs to defer network expansion and reduce
the associated consumer burden. The cost of the energy storage should instead be borne by the RES
asset owner.

HANDBOOK ON BATTERY ENERGY STORAGE SYSTEM
Impose sti penalties on utility-scale grid-connected RES owners when energy production diers
greatly from forecasts. This measure will incentivize RES owners to install energy storage systems to
reduce the forecast error.
Require distribution grid–connected RES and prosumers to install BESS to increase self-consumption
or delay supply until notified in locations where voltage rise is a problem, or risk being curtailed without
recourse.
Incentivize energy storage systems via a capacity market or other market mechanisms to replace
expensive “peaker” power plants during the evening ramp hours.
. PEAK SHAVING AND LOAD LEVELING
Network operators should be required to identify sites where it makes sense to use storage for peak
shaving instead of conventional network reinforcement. These projects should then be put up for
competitive bidding to storage developers to ensure low costs for consumers.
. MICROGRIDS
Microgrids that use renewable energy sources for power generation typically have a diesel generator set
(genset) to provide residual power and ancillary services. In such cases, the use of an energy storage
system to provide backup power and ancillary services should be encouraged in place of the diesel
genset.

Table A.: Underlying Assumptions
Item/Metric Definition/Value
Business model Frequency regulation
BESS specification MW/ MWh
Daily battery cycling cycles
Depth of discharge (DOD)
Round trip eciency
Daily energy use . MWh*
Useful life (battery cells) , cycles / cycles per day years
Useful life (balance of plant) years
Total project life years
Debt/Equity /
Cost of debt
Cost of equity
WACC
Tax rate
BESS battery energy storage system, MW megawatt, MWh megawatt-hour, WACC weighted average cost of capital.
*Daily energy use BESS power ( MW) * capacity ( MWh) * round trips per day ( cycles) * DOD per round-trip ()/round trip
eciency () . MWh.
Source: Korea Battery Industry Association “Energy storage system technology and business model”.
Table A.: Capital Expenditure
Component Content
Component Cost
USD million Units
Total Cost
USD million
Battery MWh * USD . million per MWh
Power control system (PCS) MW * USD . million per MW
HV Transformer kV / kV, MVA . .
MV Transformer kV / ., MVA . .
Storage Containers for Battery . .
Storage Containers for PCS . .
Installation . .
Battery cell replacement (Year ) . .
TOTAL PROJECT COST 7.18
HV high voltage, kV kilovolt, MV medium voltage, MVA megavolt-ampere.
Notes:
Based on average daily use, it is estimated that the battery cells will have to be replaced in year .
The cost of replacement cells in year is assumed to be of current prices.
The salvage price of the original cells in year is assumed to be of current prices.
Source: Korea Battery Industry Association “Energy storage system technology and business model”.
APPENDIX A
SAMPLE FINANCIAL
AND ECONOMIC ANALYSIS

APPENDIX A
Table A.: Operating Expenditure
Energy Cost
Daily energy charge . MWh
Annual energy charge , MWh
Power purchase price /MWh
Annual power purchase cost . million
Table A.: Revenue
Energy Revenue*
GBP/MW /MW
EFR market clearing price
.
.
Annual revenue per MW ,
Annual revenue ( MW)
. million
EFR enhanced frequency response, GBP pounds sterling, MW megawatt.
*Based on auction for EFR batteries by the National Grid (UK transmission system operator).
Table A.: Financial Internal Rate of Return
Item
Value
Project IRR .
Project NPV
(,.)
IRR internal rate of return, NPV net present value.
continued on next page
Table A.: Calculation of Financial Internal Rate of Return
Year
EFR Revenues ,, ,, ,, ,, ,, ,, ,, ,, ,, ,,
Energy
purchased
(,,) (,,) (,,) (,,) (,,) (,,) (,,) (,,) (,,) (,,)
Insurance ( of
capital cost per
year)
(,) (,) (,) (,) (,) (,) (,) (,) (,) (,)
O&M ( of
EPC contract)
(,) (,) (,) (,) (,) (,) (,) (,) (,) (,)
EBITDA ,, ,, ,, ,, ,, ,, ,, ,, ,, ,,
Less: D&A
( p.a.
straight-line)
(,,) (,,) (,,) (,,) (,,) (,) (,) (,) (,) (,)
EBIT , , , , , ,, ,, ,, ,, ,,
Less:
Intesrest
Expense
(,) (,) (,) (,) (,) (,) (,) (,) (,) (,)
Less: Taxes , , , , , (,) (,) (,) (,) (,)
Tax Net Income (,) (,) (,) (,) (,) , , , ,, ,,
Add: D&A ,, ,, ,,
,, ,, , , , , ,
Capex (,,) (,)
After Tax
Levered Cash
Flow
(,,) ,, ,, ,, ,, , , ,, ,, ,, ,,

SAMPLE FINANCIAL AND ECONOMIC ANALYSIS
Year
Levered Project
IRR
.
Levered Project
NPV
(,.)
D&A depreciation and amortization; EBIT earnings before interest and taxes; EBITDA earnings before interest, tax, depreciation,
and amortization; EFR enhanced frequency response; IRR internal rate of return; NPV net present value; O&M operation and
maintenance.
Source: Korea Battery Industry Association “Energy storage system technology and business model”.
Note: To calculate the economic internal rate of return:
• Replace EFR earnings with economic benefit (incremental and non-incremental).
• Use discount rate in NPV calculation.
For comparison, -megawatt-equivalent capacity storage of each resource type was considered. In
the solar-plus-storage scenario, the following assumptions were made: -megawatt (MW), -hour
lithium-ion battery energy storage system coupled with a MW solar photovoltaic system, and a
project life of years.
Energy storage technology cost assumptions were selected by means of projected cost information
collected from vendors and public information sources (University of Minnesota Energy Transition Lab,
Strategen Consulting, and Vibrant Clean Energy ).
With this information, the installed cost for a -hour, MW lithium-ion battery storage system was
assumed to be about , per kilowatt for a start date, representing the total all-in cost of the
storage medium; the power conversion system; engineering, procurement, and construction (EPC);
replacements; and other ongoing and recurring costs.
The table below shows that energy storage installed costs are foreseen to improve to ,/kW by
. Improvements are also anticipated in the fixed O&M costs and round trip eciencies over time.
Table A.: Calculation of Financial Internal Rate of Return
(University of Minnesota Energy Transition Lab, Strategen Consulting, and Vibrant Clean Energy )
Scenario:
Storage Only
()
Storage Only
()
Solar Storage
()
Solar Storage
()
Size/Duration MW/ hrs MW/ hrs MW/ hrs MW/ hrs
Installed Cost (-hrs) /kW /kW /kW /kW
Fixed O&M /kW-yr /kW-yr /kW-yr /kW-yr
Variable O&M /MWh /MWh /MWh /MWh
Round Trip Eciency
(incl. auxiliaries)
P. Sheilds, “Modernizing Minnesota’s Grid : An Economic analysis of Energy storage opportunities,” in Minnesota Energy Storage
Strategy Workshop, July, , .
continued on next page
Table A. continued

APPENDIX A
Scenario:
Storage Only
()
Storage Only
()
Solar Storage
()
Solar Storage
()
Installed Cost /kW Base Case:
/kW
Sensitivity:
/kW
/kW /kW
Fixed O&M ./kW-yr ./kW-yr ./kW-yr ./kW-yr
Variable O&M ./MWh ./MWh ./MWh ./MWh
Capacity Factor
Heat Rate , BTU/kWh Base Case:
, BTU/kWh
Sensitivity:
, BTU/kWh
, BTU/kWh , BTU/kWh
BTU British thermal unit, kW kilowatt, kWh kilowatt-hour, MWh megawatt-hour, O&M operation and maintenance.
Source: P. Sheilds, “Modernizing Minnesota’s Grid : An Economic analysis of Energy storage opportunities,” in Minnesota Energy
Storage Strategy Workshop, July, , .
For solar plus storage, dispatch is optimized to ensure that of charging energy comes from
eligible renewable resources. This was applied to the portion of the project’s storage equipment costs
corresponding to the fraction of output energy that is charged directly from renewable resources (solar
photovoltaic). For projects starting in , the applied assumes that projects begin construction
before December .
Table A. continued

The installation price of megawatts (MW) of wind power was set at , thousand won/kilowatt
(kW), the rate provided by the Korea Energy Agency. For the average usage rate of wind-power
generators, the average usage rate of . for a specific wind power complex in the Republic of Korea
was applied.
Table B.: Major Premises and Assumptions for Simple Levelized Cost of Electricity Estimations
of Wind Power
Category Item Price
(Unit Cost)
Remarks
Technological
premise
Total installation capacity MW
Installation price , thousand won/kW Internal data of the Korea Energy
Agency ()
Fixed cost . of total construction cost
Variable cost . of total generation cost On-site consumption rate
Average usage rate . Product of specific company in
specific region
Performance decline rate
Financial/
Economic premise
Facility life years
Discount rate . KDI public investment project
discount rate
Inflation rate
Won/dollar exchange rate , Average exchange rate in
ESS Total facility capacity MWh of total wind-power
capacity of facility
Installation price . billion/MWh KEPCO’s frequency adjustment
ESS installation project
Lithium cell price /kWh BNEF
Life years , cycles (replace after
years)
Loss rate Charging/discharging and
standby loss
BNEF Bloomberg New Energy Finance, ESS energy storage system, KDI Korea Development Institute, KEPCO Korea Electric
Power Corporation, kW kilowatt, kWh kilowatt-hour, LCOE levelized cost of electricity, MW megawatt, MWh megawatt-hour.
APPENDIX B
CASE STUDY OF A WIND POWER PLUS
ENERGY STORAGE SYSTEM PROJECT IN THE
REPUBLIC OF KOREA

APPENDIX B
The generation price of wind power plus energy storage system (ESS) is . won per kilowatt-hour
(kWh), higher than that for gas turbine generators. When only wind power is installed, the generation
price is . won. This figure is only slightly higher than the average system marginal price (SMP)
of . won/kWh, showing that wind-power generation is close to grid parity.
Installing ESS raises the generation price above the SMP, thus reducing economic feasibility. Also,
adding ESS to wind power increases the total construction cost by ., from , million won to
, million won, and the generation price by .. The increase in generation price is higher than
the rise in construction cost mainly because, while no additional facilities are installed, passage through
the battery adds a ESS charging and discharging and standby loss rate for the generated amount,
thus lowering the amount of commercial power supply. When only MW of wind power is installed,
the annual generation amount expected in the first year is . gigawatt-hours (GWh); when ESS is
added, the amount of generation that can be commercially supplied drops by ., to . GWh.
In the case of wind power, the power price (commercial levelized cost of electricity, or LCOE) must be
at least . won/kWh—. higher than the generation price (simple LCOE) of . won/kWh—for
wind power plus ESS to be commercially feasible.
Table B.: Comparison of Levelized Cost of Electricity for Wind Power Generation
at Various Energy Storage System Operating Rates
ESS Operating
Rate
Simple LCOE
(won/kWh)
Commercial LCOE
(won/kWh)
Total Investment
Cost
(billion won)
ESS Investment
Cost
(billion won)
. . . -
.
(.)
.
(.)
.
(.)
.
.
(.)
.
(.)
.
(.)
.
.
(.)
.
(.)
.
(.)
.
ESS energy storage system, LCOE levelized cost of electricity.
Note: Digits within parentheses show the rate of increase compared with the ESS capacity rate of .
The relationship between the increase in generation price and the increase in total investment costs
shows that when the ESS capacity rate rises from to , the total investment cost rises by only
.; the generation price, on the other hand, goes up by ., a rate . times higher than the rate
of increase in investment cost.
The dierence between the two rates of increase becomes . times higher at an ESS operating rate
of , and . times higher at an ESS operating rate of . The minimum power cost for commercial
feasibility exhibits trends similar to that for generation cost.
Like solar power generation, wind power generation has several marked characteristics:
• When investments for wind power generation facilities increase, the generation cost does
not change much, but when ESS is added to the generation facilities, the generation cost
increases.

CASE STUDY OF A WIND POWER PLUS ENERGY STORAGE SYSTEM PROJECT IN THE REPUBLIC OF KOREA
• When ESS investments increase, the amount of increase in generation costs also goes up.
• The increase rate for generation cost is about . times higher than the increase rate for
investment scope.
An ESS charging and discharging and standby loss rate of was assumed in the foregoing analysis,
which shows the generation cost and the amount of generation in the first year of operation at an ESS
charging rate of , a discharging rate of , and standby loss rate of . Installing an ESS with
an operating rate of reduces the amount of generation by ., from . GWh to . GWh,
when the standby loss rate is assumed to be ; by ., from . GWh to . GWh, at an assumed
standby loss rate of ; and by ., from . GWh to . GWh, when the standby loss rate is
. The generation cost also changes accordingly. Installing an ESS with an operating rate of
increases the generation cost by ., from . won/kWh to . won/kWh, when the standby
loss rate is ; by ., from . won/kWh to . won/kWh, when the standby loss rate is ;
and by ., from . won/kWh to . won/kWh, when the standby loss rate is . The rate of
increase in generation cost rises by . times compared with the rate of increase in investment costs
when the loss rate is assumed to be and the ESS operating rate to be , and by . times when
the loss rate is and the ESS operating rate is .
When a total charging and discharging and standby loss rate of is assumed, using ESS at power
compensation for solar power and wind power generators raises the cost per kWh (simple LCOE) by
. won per kWh for solar power and by . won for wind power compared with a situation where
ESS is not used as such. ESS is evidently a more economical technology alternative than reserve power
sources such as gas turbines and coal power. The ESS operating rate (compared with the generation
facility) in which the cost of power compensation becomes similar to that for gas turbines is about
compared with solar power and about compared with wind power. The ESS operating rate in
which the cost of power compensation becomes similar to that for coal power is about compared
with solar power and about when compared with wind power. In other words, it is evident
that when ESS is used for power compensation, it can be a more economical alternative at a higher
operating rate when installed in wind power generators compared with solar power.
In the case of wind-power generators, the amount of generation used as output variation by ESS
in wind power plus ESS () generators is , MWh in the first year. Applying the dierence
between the normal price of coal power and the normal price of LNG and coal power to this amount
of generation results in total benefits in the first year of about . million won and . million
won, respectively. Reflecting the benefits of using methods such as solar power generation in the
LCOE computation results in corresponding figures of . won/kWh and . won/kWh. The
generation cost with wind power alone, the generation cost of wind power ESS, and the LCOE, taking
into consideration the system benefits of wind power ESS. When only wind power is installed, the
generation price is . won/kWh, and when ESS is added to this, the generation price rises by .
won/kWh, to . won/kWh. When the system benefits are taken into account, the generation cost
becomes . won/kWh, which is . won/kWh lower than the generation costs of wind power plus
ESS—almost at the same level as that of the generation cost for wind power alone.

Although model-supported analysis of stationary storage systems has been conducted for specific storage technologies and applications, little existing work
summarizes well the present modeling and simulation methods. Several distinct objectives often require specific approaches.
A noncomprehensive overview of some readily available modeling tools, with their respective aims, strengths, and shortcomings, is presented below.
Table C.: Available Modeling Tools
Modeling Tool Description
PerModAC PerModAC was developed by researchers at the University of Applied Sciences in Berlin (HTW Berlin),
Germany, to model the eciency of PV–BESSs. While the model features an integrated approach, including all
components relevant to eciency-modeling of PV–BESSs (battery, inverter, standby, and energy management
system control), the tool, in its present version, is confined to AC coupling of BESSs and does not allow
modeling of battery aging.
Storage Value Estimation
Tool (StorageVET)
StorageVET, developed by the US Electric Power Research Institute (EPRI), is focused on profitability analysis of
utility-scale storage projects. This web-based tool allows straightforward value estimation for BESSs based on a
set of predefined technical and economic input parameters.
Battery Lifetime Analysis
and Simulation Tool
(BLAST)
BLAST is a toolkit provided by NREL in the US. The focus is on LIB modeling, based on detailed battery aging
degradation analysis and functionality, for long-term battery lifetime prediction. For use in automotive and
stationary applications, several specialized variants exist (e.g., BLAST for Behind-the-Meter Applications, for
peak-shaving application; BLAST for Stationary Applications, for other utility-scale applications).
Simulation of Stationary
Energy Storage Systems
(SimSES)
SimSES is a modular object-oriented tool chain initiated and coordinated by researchers at the Technical
University of Munich in Germany. The MATLAB code–based tool-kit allows holistic technical and economic
modeling of storage systems in variable applications. It features pre-implemented battery models (e.g., variants
of LIB cells), and includes storage system and grid integration components (e.g., thermal management, power
electronics components) and some exemplary use cases (e.g., PV–BESS, utility-scale control reserve).
Hybrid Optimization of
Multiple Energy Resources
(HOMER)
HOMER, originally developed by NREL in the US, is available as a commercial tool for microgrid modeling
and optimization featuring fossil generation, renewable power sources, storage, and load management. The
focus is therefore not on the battery itself but on the full grid level. For microgrid applications, straightforward
cost optimization can be done with the help of HOMER, and storage system modeling features estimation of
eciency, self-discharge, and aging.
System Advisor Model
(SAM)
SAM is a tool specifically designed for lead–acid and LIB modeling in PV–BESS applications. The battery
modeling is based on detailed capacity, voltage, and thermal and lifetime sub-models, which can be
parameterized, e.g., with the use of battery data sheets. For time-series calculations, user-defined operation
strategies are required. In conjunction with financial modeling parameters, SAM allows straightforward techno-
economic analysis. Like PerModAC, in its present version, SAM is limited to AC coupling of storage.
Modeling and
Optimization of
DERs-Based Systems
(MODERS)
MODERS is a tool package aimed at the optimal sizing and economic evaluation of distributed energy resources
in various applications. The package consists of a number of business model design programs, each of which
was designed for a specific application such as load management, renewable-generation sale, energy prosumer,
or community energy service. MODERS leads nontechnical users to readily follow preestablished procedures,
oering a series of functions for assessing available energy from DERs, establishing optimal scheduling,
estimating operating benefits, and finally determining optimal capacity. The tool package covers various DERs
but is highly focused on BESS in terms of optimal sizing.
AC alternating current, BESS battery energy storage system, DER distributed energy resource, LIB lithium-ion battery, MATLAB matrix laboratory,
NREL National Renewable Energy Laboratories, PbA lead–acid, PV photovoltaic, US United States.
Source: Korea Battery Industry Association “Energy storage system technology and business model”.
APPENDIX C
MODELING AND SIMULATION TOOLS FOR
ANALYSIS OF BATTERY ENERGY STORAGE
SYSTEM PROJECTS
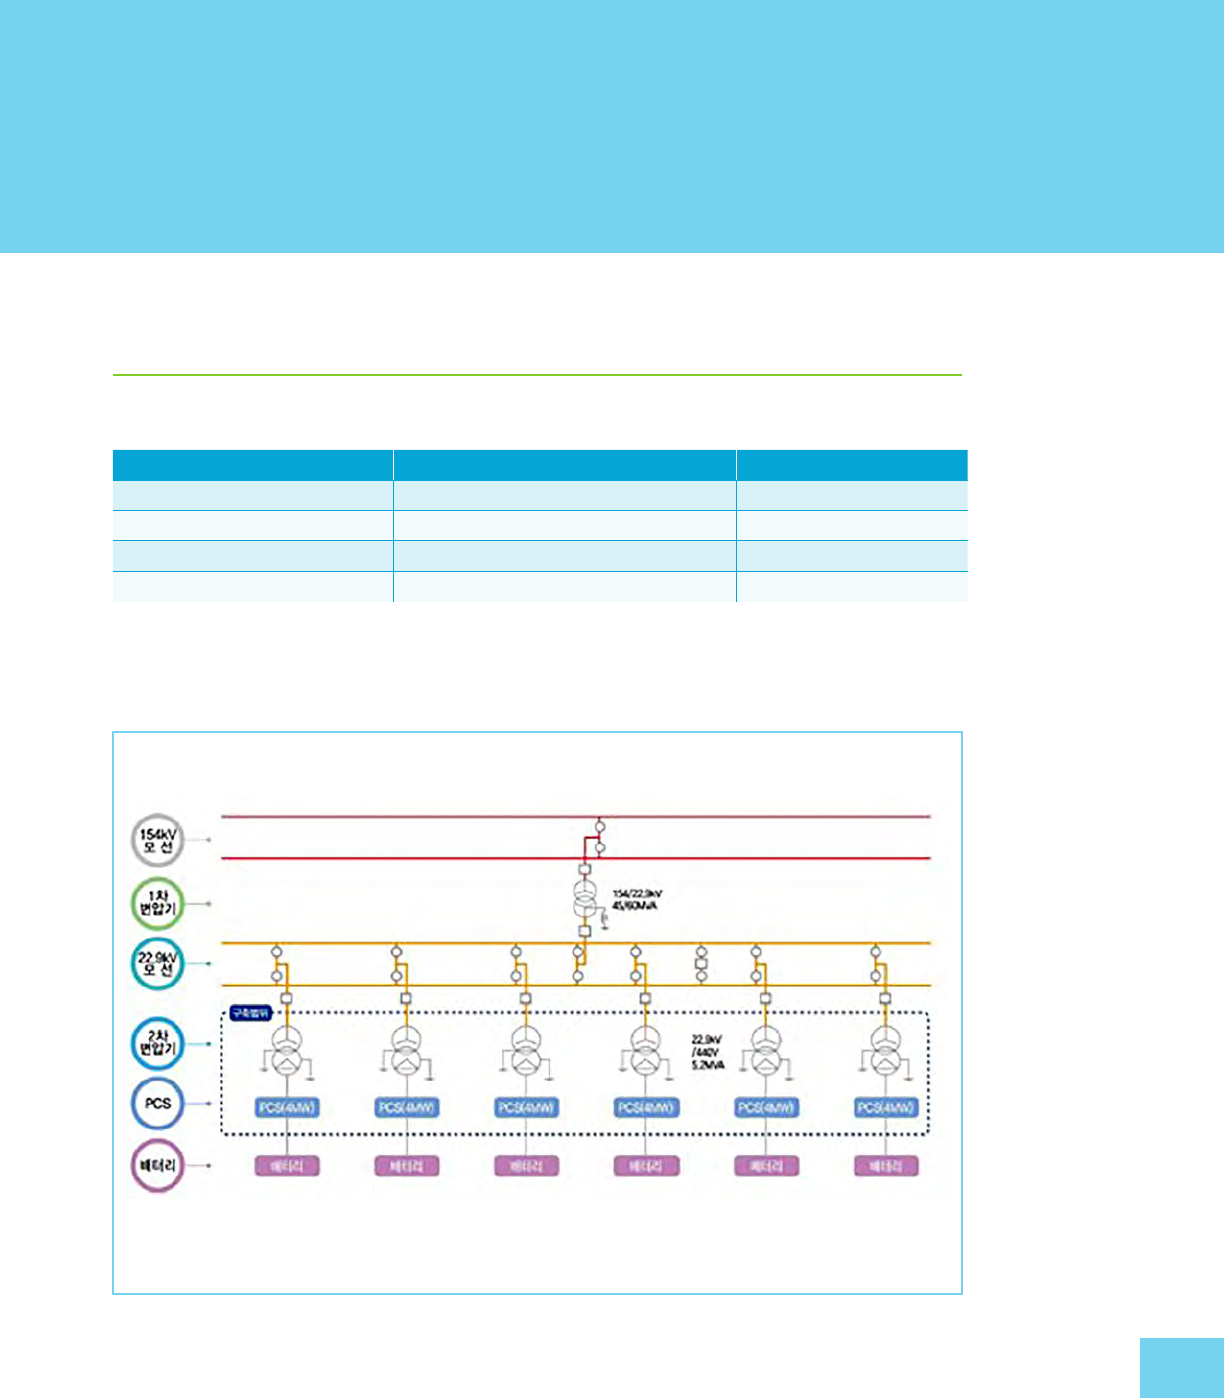
D. FREQUENCY REGULATION
Table D.: Sokcho Substation, Republic of Korea—BESS Equipment Specifications
Component Specifications Quantity
PCS Containers ( MW each)
PMS Human machine interface (HMI)
Transformers . kV/ V, . MVA
Cabling AC/DC cable
AC alternating current, BESS battery energy storage system, DC direct current, MVA megavolt-ampere, MW megawatt,
PCS power conversion system, PMS power management system, V volt.
Source: Korea Battery Industry Association “Energy storage system technology and business model”.
APPENDIX D
BATTERY ENERGY STORAGE SYSTEM
IMPLEMENTATION EXAMPLES
Figure D.: Sokcho Single Line Diagram
kV kilovolt, MVA megavolt-ampere, MW megawatt, PCS power conversion system.
Source: Korea Battery Industry Association “Energy storage system technology and business model”.
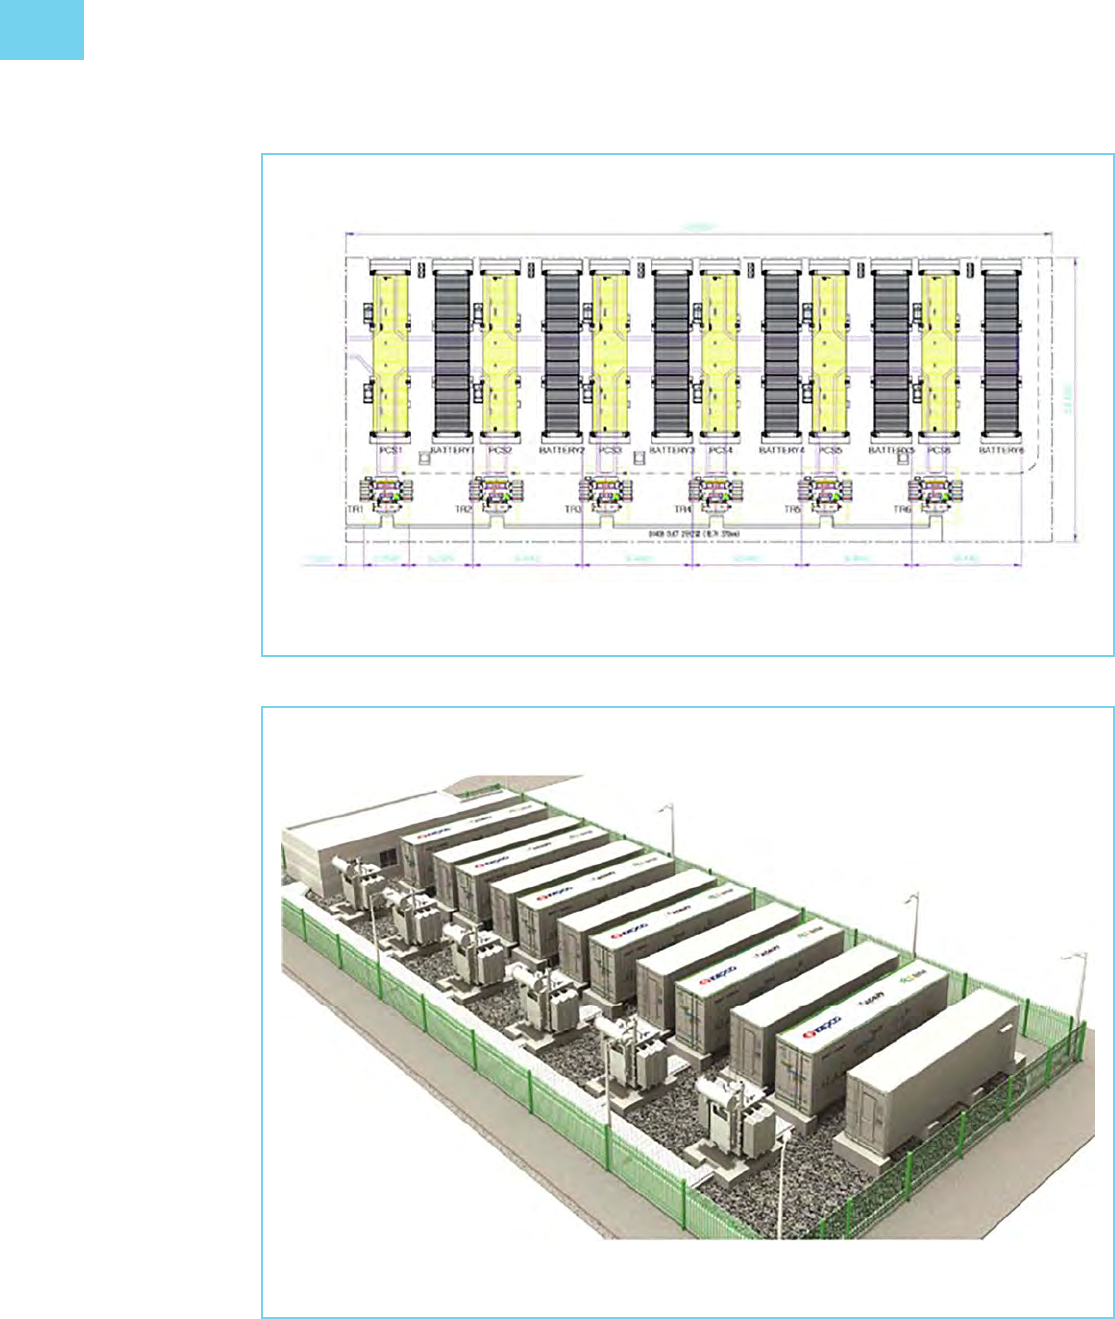
APPENDIX D
Figure D.: Sokcho Site Plan
PCS power conversion system.
Source: Korea Battery Industry Association “Energy storage system technology and business model”.
Figure D.: Bird’s-Eye View of Sokcho Battery Energy Storage System
Source: Korea Battery Industry Association “Energy storage system technology and business model”.
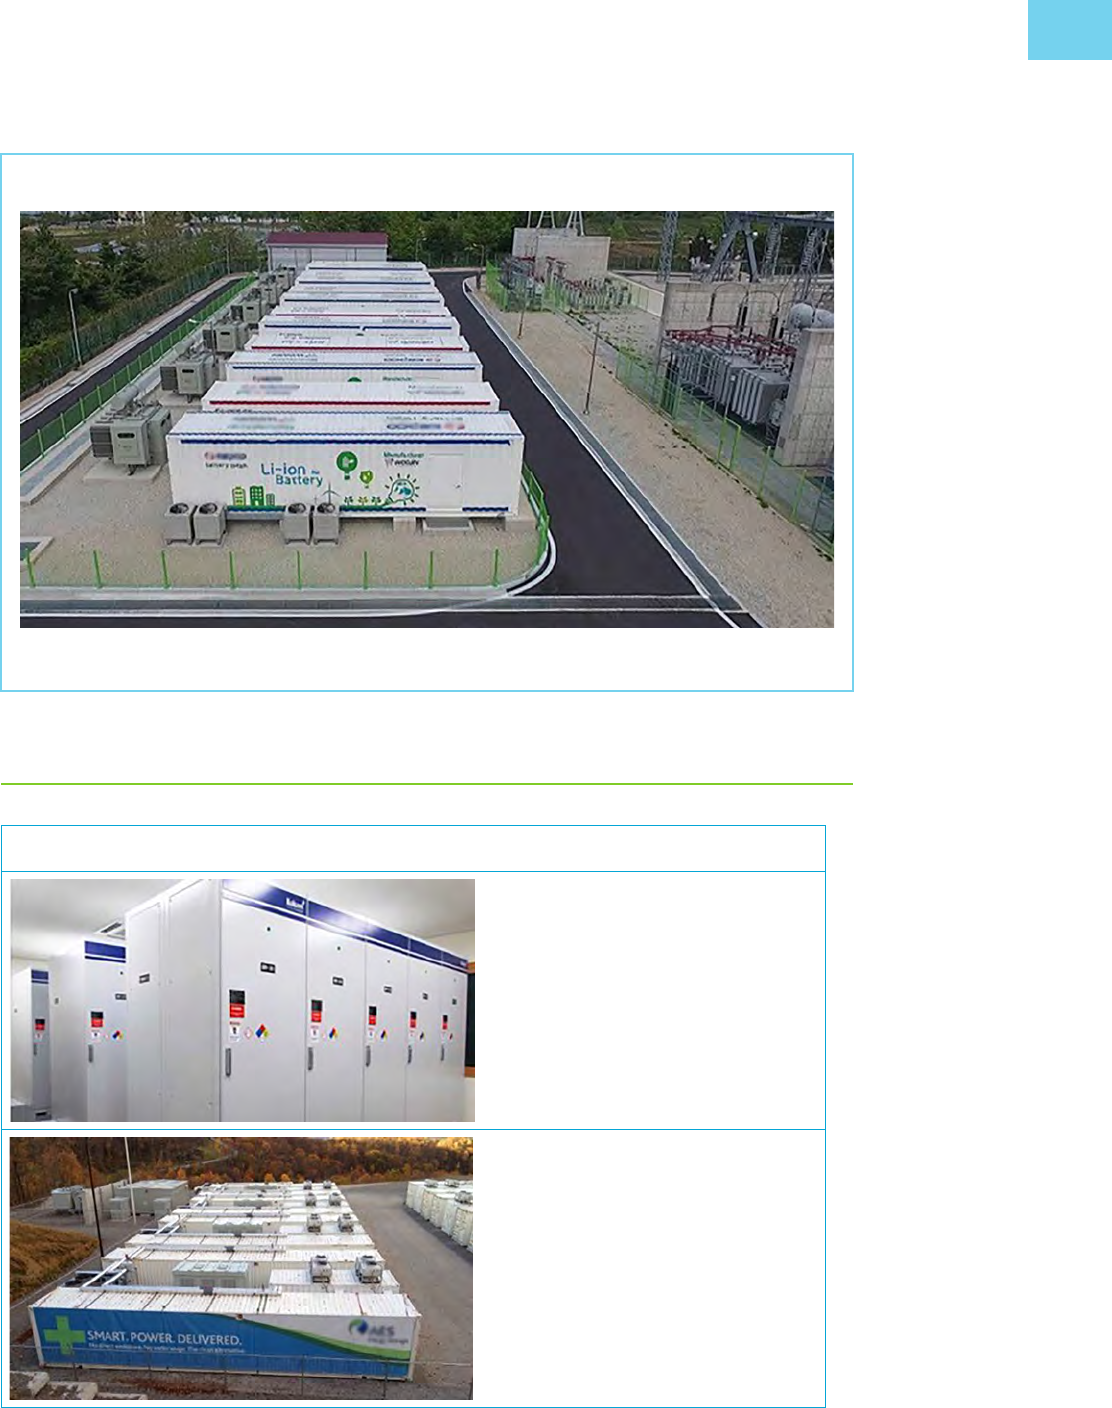
BATTERY ENERGY STORAGE SYSTEM IMPLEMENTATION EXAMPLES
D. RENEWABLE ENERGY INTEGRATION
Figure D.: BESS Applications in Renewable Energy Integration
. MW/. MWh
Gasa Island, Republic of Korea
KEPCO/Renewable (PV, wind) Integrated
Wind: MW
ESS PCS: MW
Elkins, West Virginia, United States
Figure D.: Sokcho Battery Energy Storage System
Source: Korea Battery Industry Association “Energy storage system technology and business model”.
continued on next page
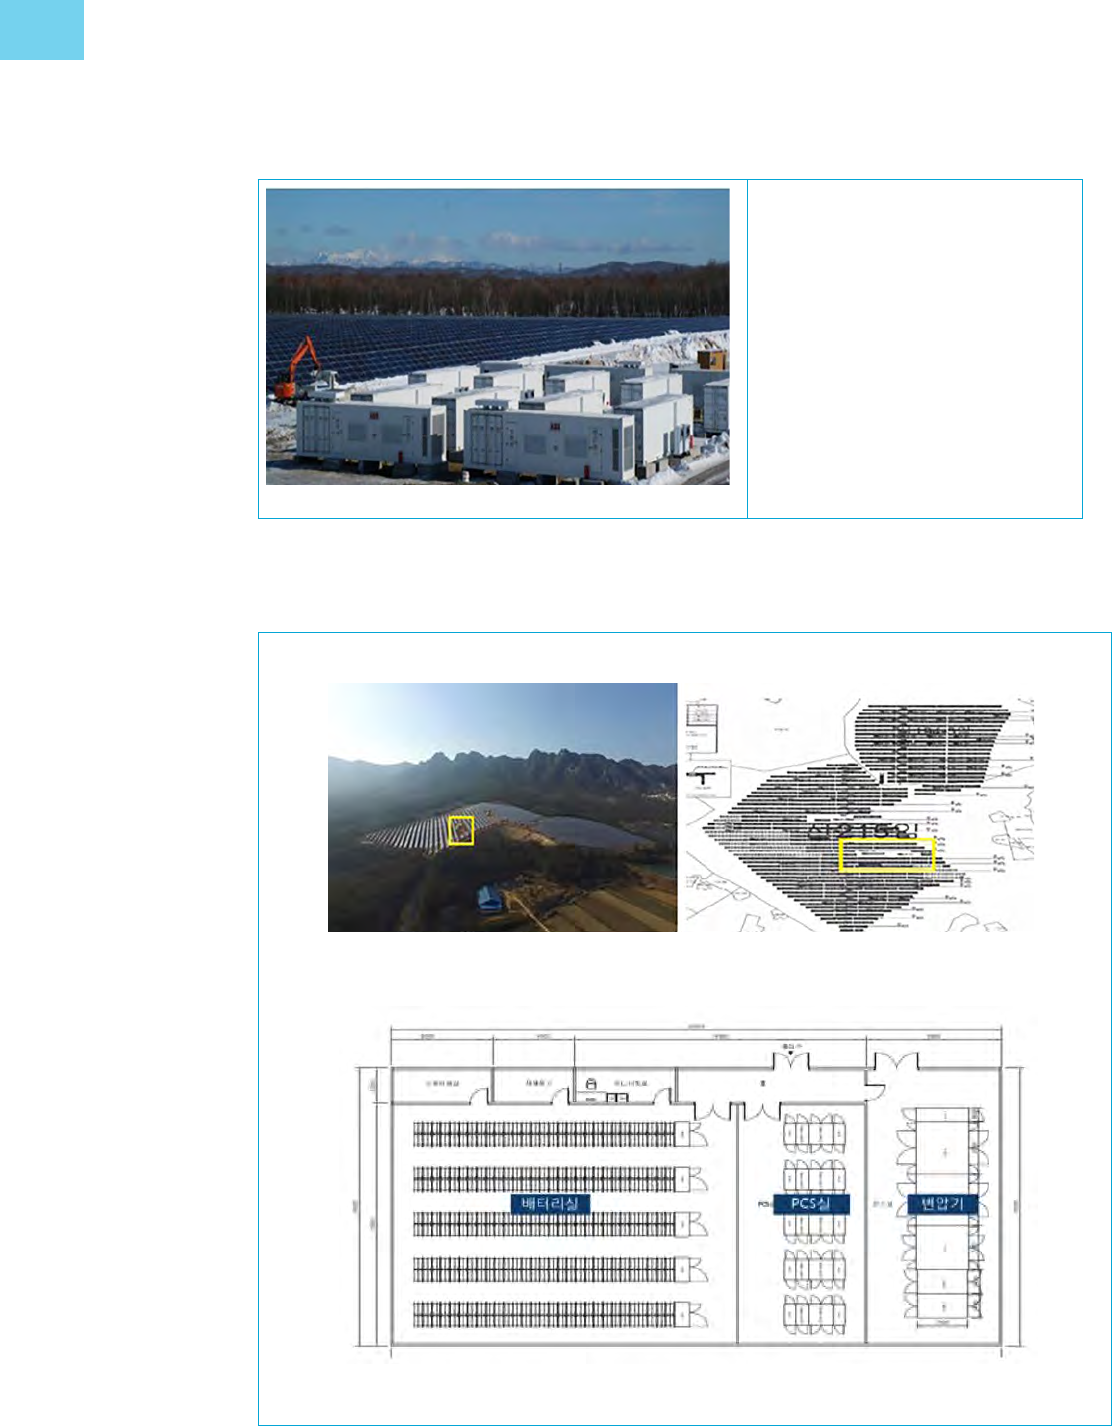
APPENDIX D
Solar PV: MW
ESS PCS: MW
Chitose, Hokkaido, Japan
ESS energy storage system, KEPCO Korea Electric Power Corporation, MW megawatt, MWh megawatt-hour, PCS power
conversion system, PV photovoltaic.
Source: Korea Battery Industry Association “Energy storage system technology and business model”.
Figure D continued
Figure D.: MW Yeongam Solar Photovoltaic Park, Republic of Korea
Site
MW megawatt, PCS power conversion system.
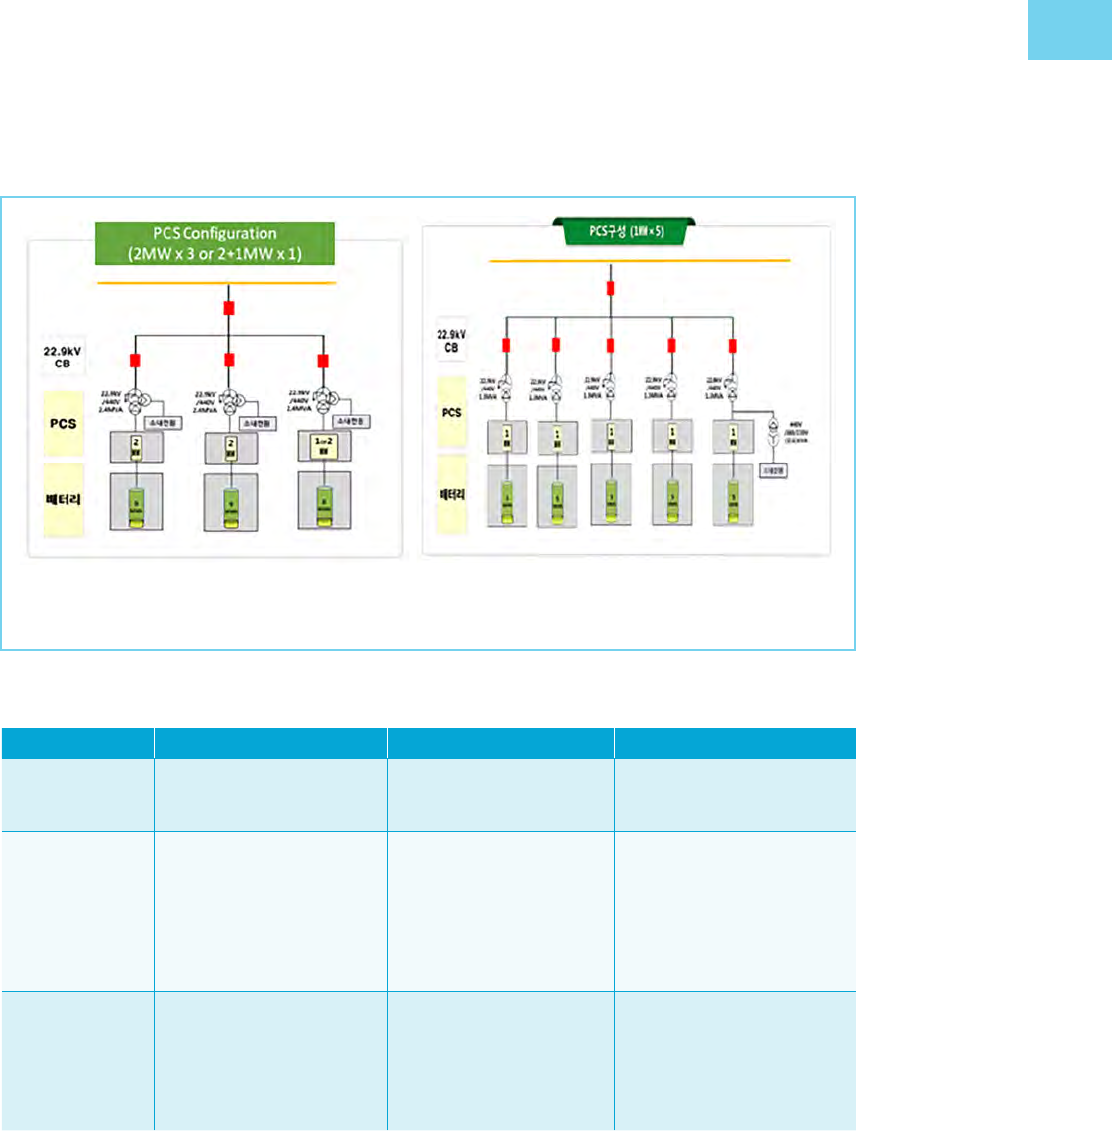
BATTERY ENERGY STORAGE SYSTEM IMPLEMENTATION EXAMPLES
Figure D continued
Table D.: Other Examples of BESS Application in Renewable Energy Integration
Configuration Wind ESS PV ESS PV Wind ESS
Site Chonnam National University Kolon Global, Sebang Sebang, Mokpo National
University, JIAT, KETI
Specifications kW (wind)
kW (bidirectional
converter)
. kWh ESS
kW (PV)
PV PCS
kWh ESS
kW (PV)
kW (wind)
kW (bidirectional
converter) PCS
ESS ( kWh)
kW EV (high-speed battery
charger)
ESS capacity . kWh
(Ni–MH, Ah, cell)
kWh
(Ni–MH, Ah, cell)
Rapid: kWh
(Ni–MH, Ah, cell)
Full: kWh
(Ni–MH, Ah, cell)
Ah ampere-hour, ESS energy storage system, EV electric vehicle, JIAT Jeonbuk Institute of Automotive Technology, KETI
Korea Electronics Technology Institute, kW kilowatt, kWh kilowatt-hour, Ni–MH nickel–metal hydride, PCS power conversion
system, PV photovoltaic.
CB circuit breaker, kV kilovolt, MW megawatt, PCS power conversion system.
Source: Korea Battery Industry Association “Energy storage system technology and business model”.
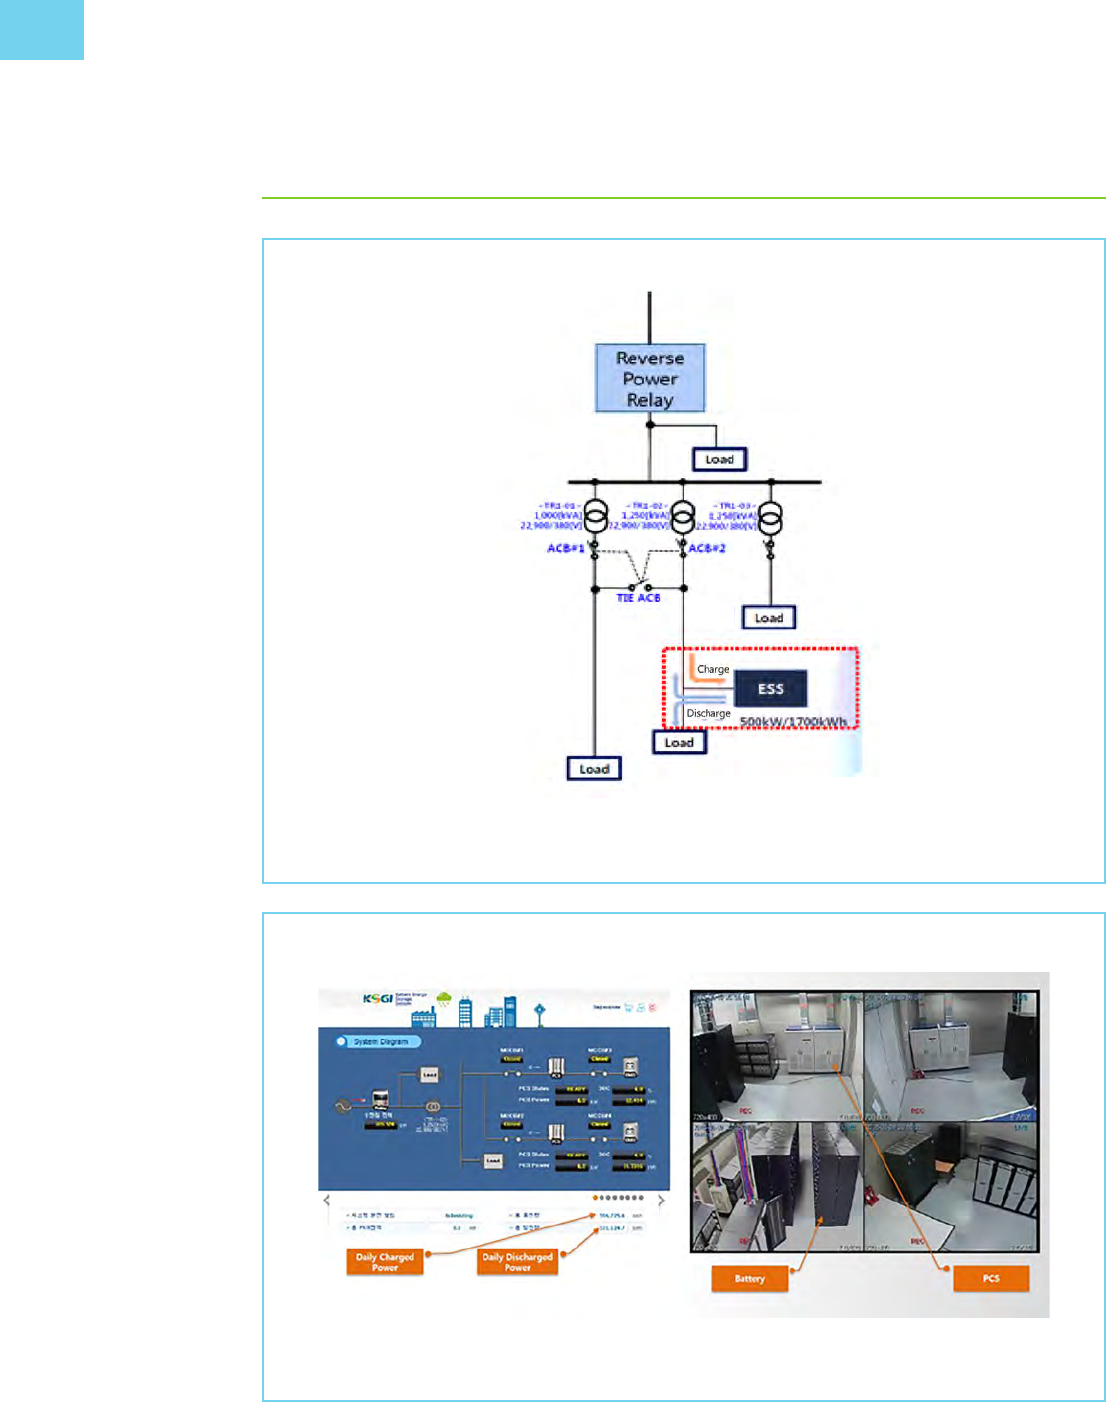
APPENDIX D
Figure D.: Peak Shaving at Douzone Oce Building, Republic of Korea
ESS Energy Storage System, kW kilowatt, kWh kilowatt-hour.
Source: Korea Battery Industry Association “Energy storage system technology and business model”.
Figure D.: Douzone Oce Building System Diagram and CCTV Screen Capture
PCS power conversion system.
Source: Korea Battery Industry Association “Energy storage system technology and business model”.
D. PEAK SHAVING
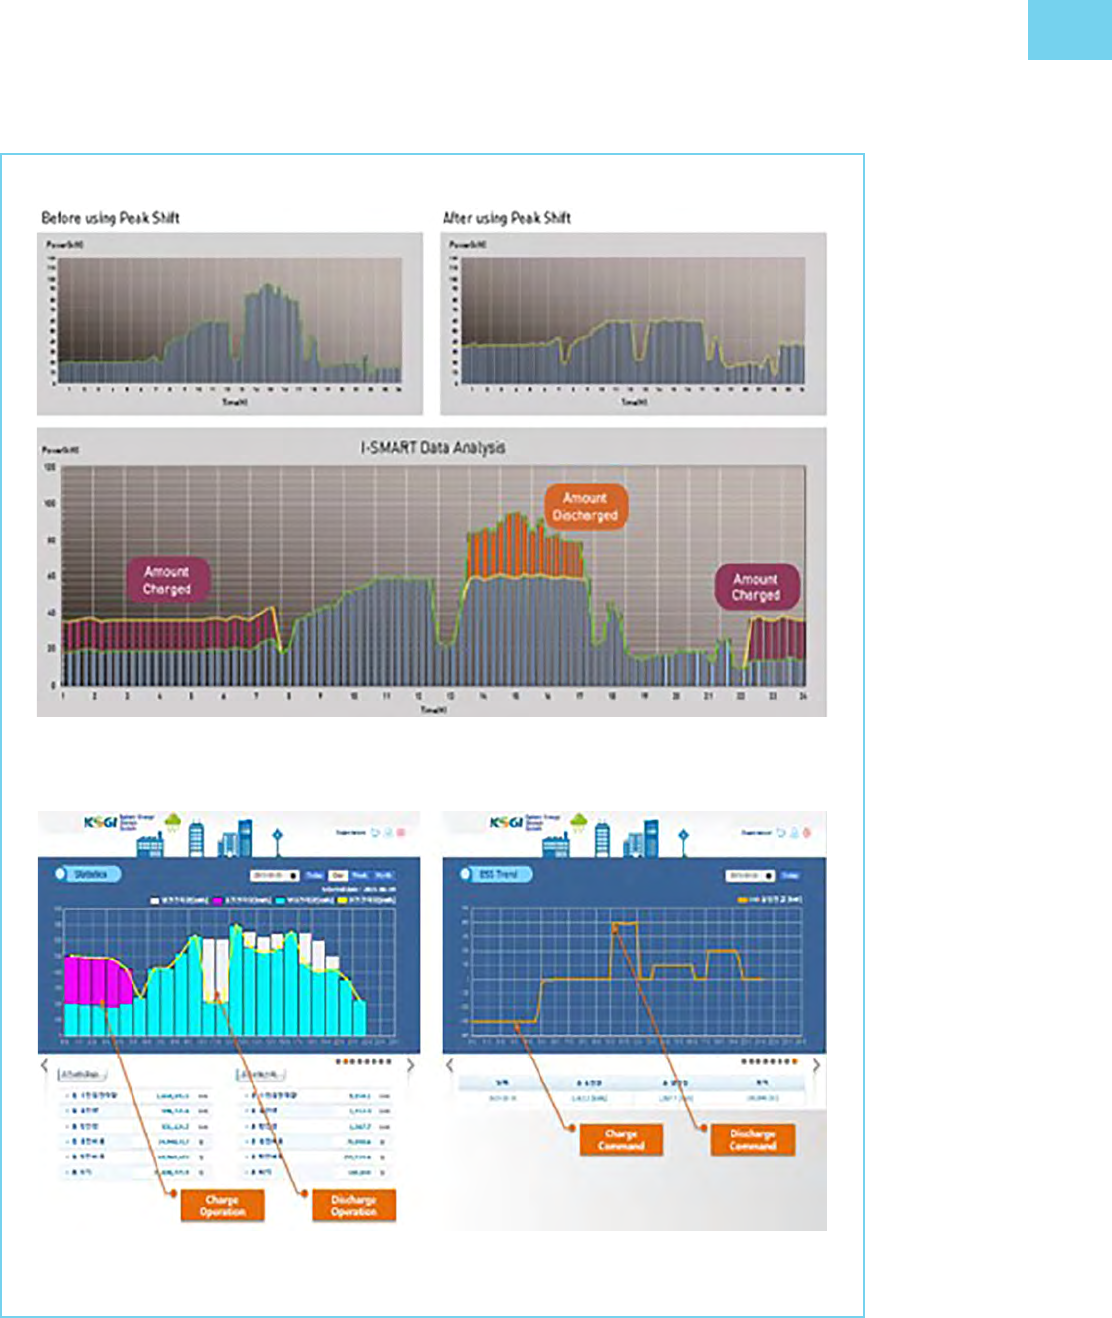
BATTERY ENERGY STORAGE SYSTEM IMPLEMENTATION EXAMPLES
Figure D.: Graphical Illustration of Peak Shaving at Duozone Oce Building
Source: Korea Battery Industry Association “Energy storage system technology and business model”.
Source: Korea Battery Industry Association “Energy storage system technology and business model”.
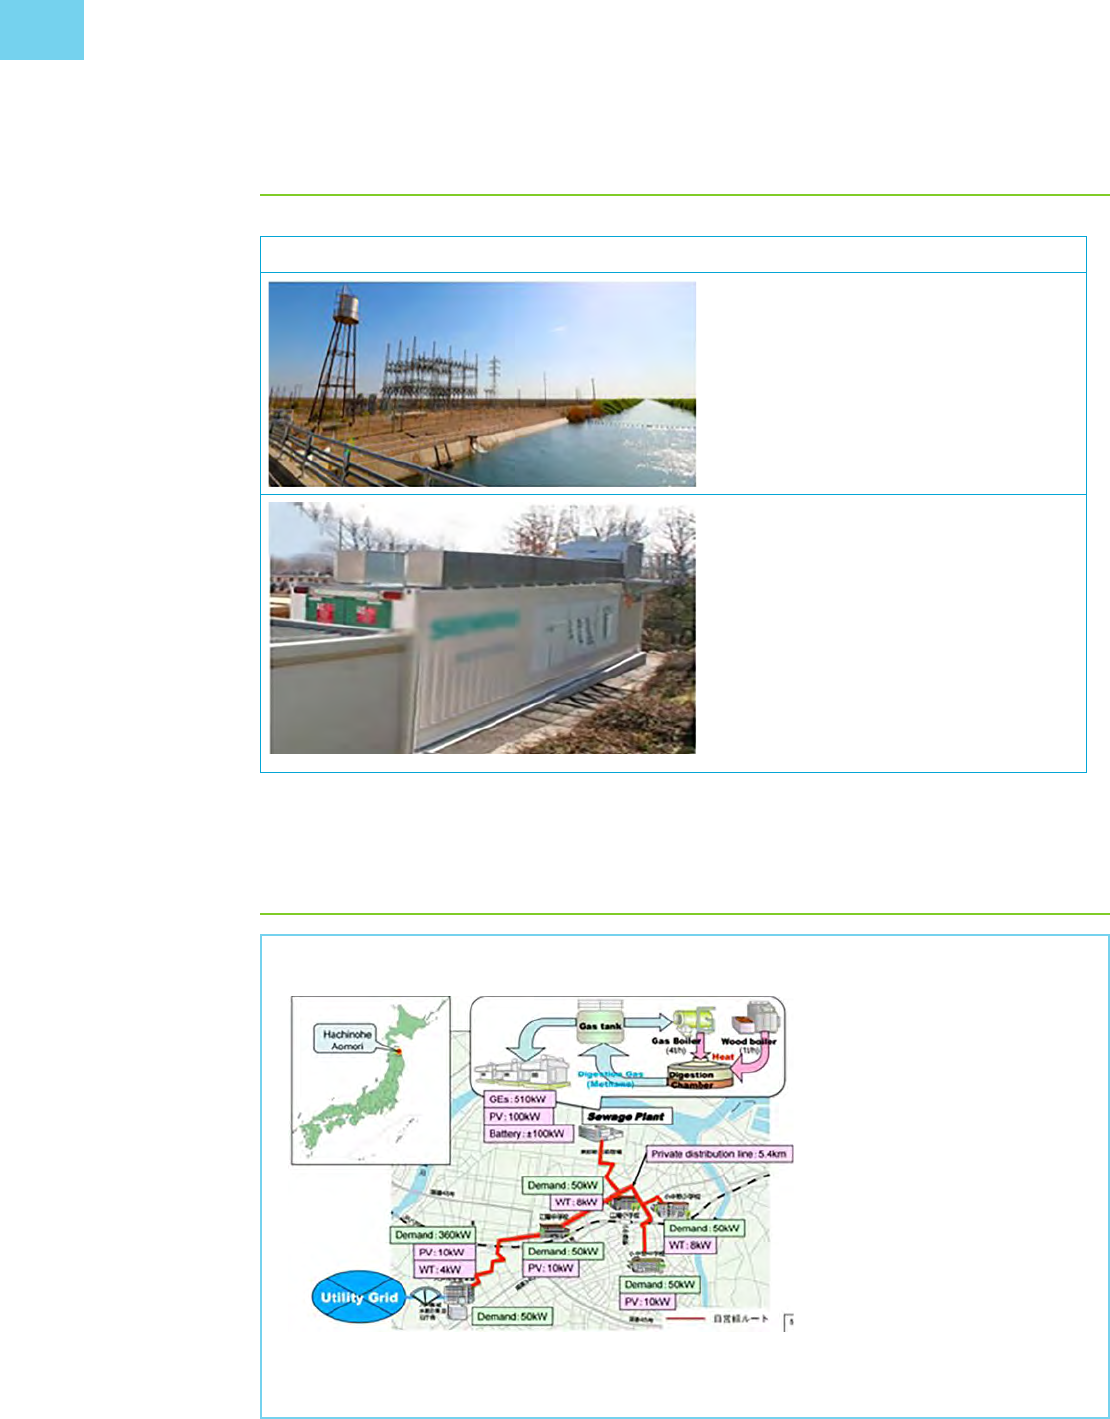
APPENDIX D
D. BLACK START
Figure D.: Black Start Capability
Smart Electric Power Association (SEPA),
Southern California, US
MW/ MWh (BESS)
MW (combined-cycle gas turbine)
Vulkan Energiewirtschaft Oderbrücke (Vulkan
Energy Bridge) GmbH, Germany
kWh (BESS)
kW (gas turbine)
BESS battery energy storage system, kW kilowatt, kWh kilowatthour, MW megawatt, MWh megawatt-hour.
Source: Korea Battery Industry Association “Energy storage system technology and business model”.
D. MICROGRIDS
Figure D.: First Microgrid System on Gapa Island
Hachinohe: First stage of
microgrid in Japan (2003–2007)
• Electricity: kW ( X )
biogas engines, kW PV,
kW wind turbines, kW lead–
acid battery
• Heat: . ton/h wood boiler
and tons/h gas boiler Energy
management
• . km private lines (electricity
and communication)
• Interconnected with utility grid
at a single point
• Control error target: within
every minutes moving average
Source: “Microgrid Projects,” [Online]. Available: http://microgridprojects.com/microgrid/hachinohe-microgrid/.
continued on next page
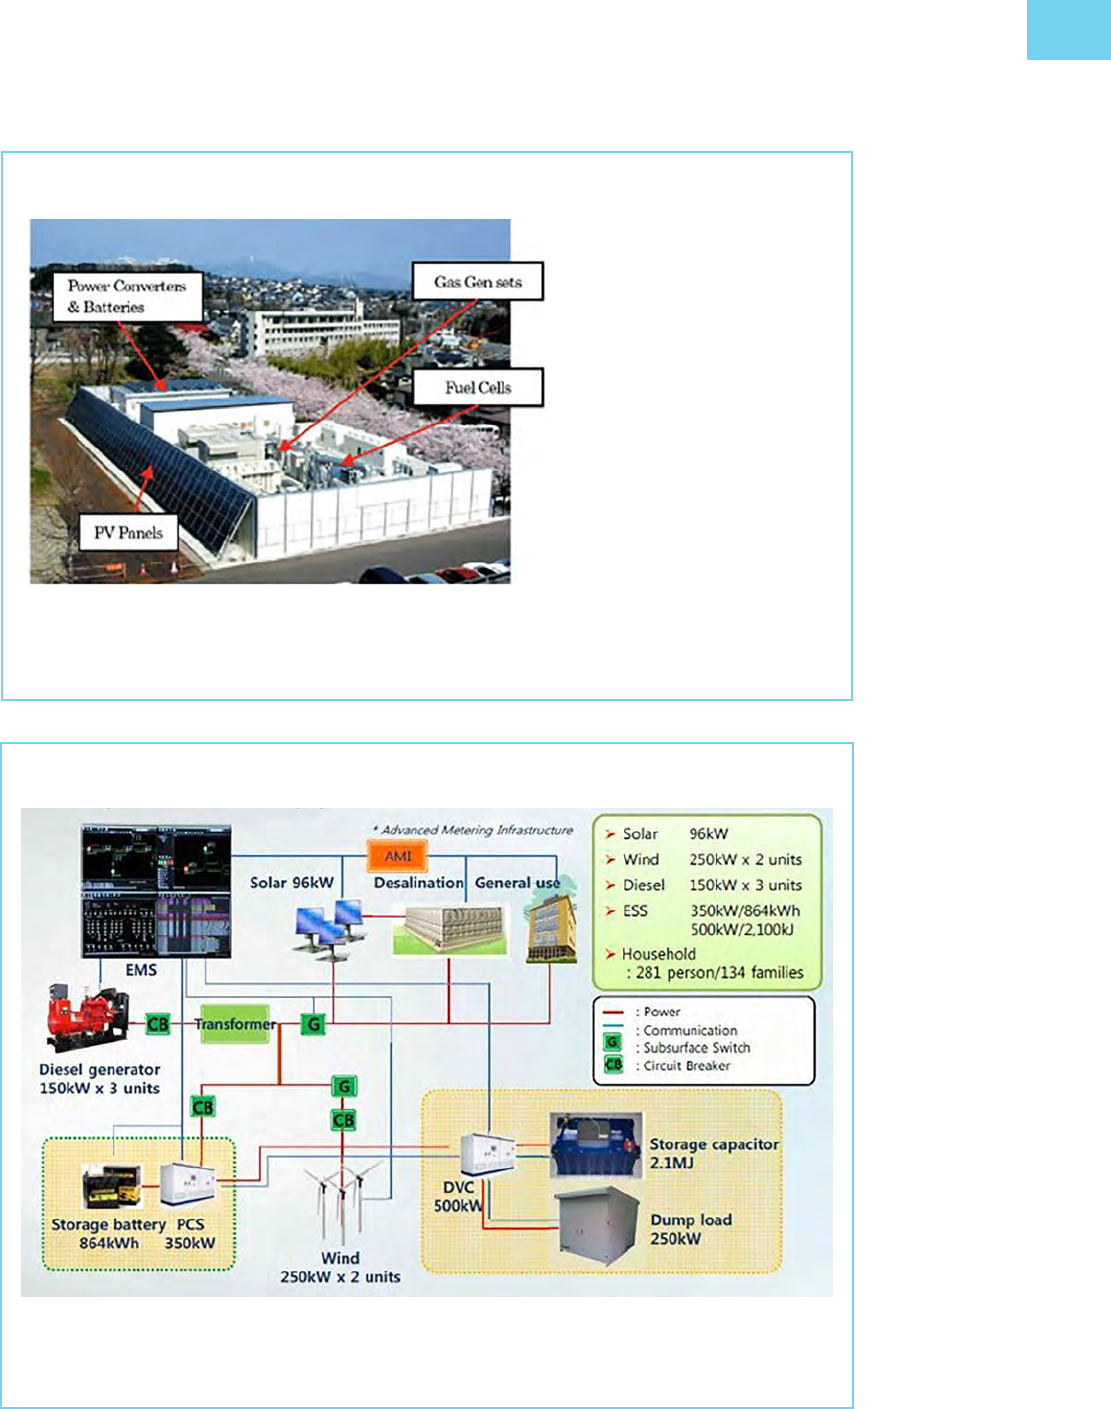
BATTERY ENERGY STORAGE SYSTEM IMPLEMENTATION EXAMPLES
Figure D.: System Configuration of Microgrid on Gapa Island
CB circuit breaker, EMS energy management system, ESS energy storage system, G ground fault, kJ kilojoule, kW
kilowatt, kWh kilowatt-hour, MJ megajoule, PCS power conversion system.
Source: Korea Battery Industry Association “Energy storage system technology and business model”.
Figure D.: Sendai Microgrid project (Shimizu )
Sendai Microgrid Project
• Constructed as a -year
demonstration project
• Entrusted by NEDO
• Technical feature: Multiple
Power Quality Microgrid
(MPQM)
– Desired power quality varies
by customer in the microgrid
– MPQM enables power
supply with dierent levels
of power quality for dierent
customers in the area
Source: Y. Shimizu, “Microgrid related
activities in Japan,” in New Energy and
Industrial Technology Development
Organization (NEDO), Sep., .
genset generator set, kW kilowatt, km kilometer, NEDO New Energy and Industrial Technology Development
Organization, PV photovoltaic.
Source: Korea Battery Industry Association “Energy storage system technology and business model”.
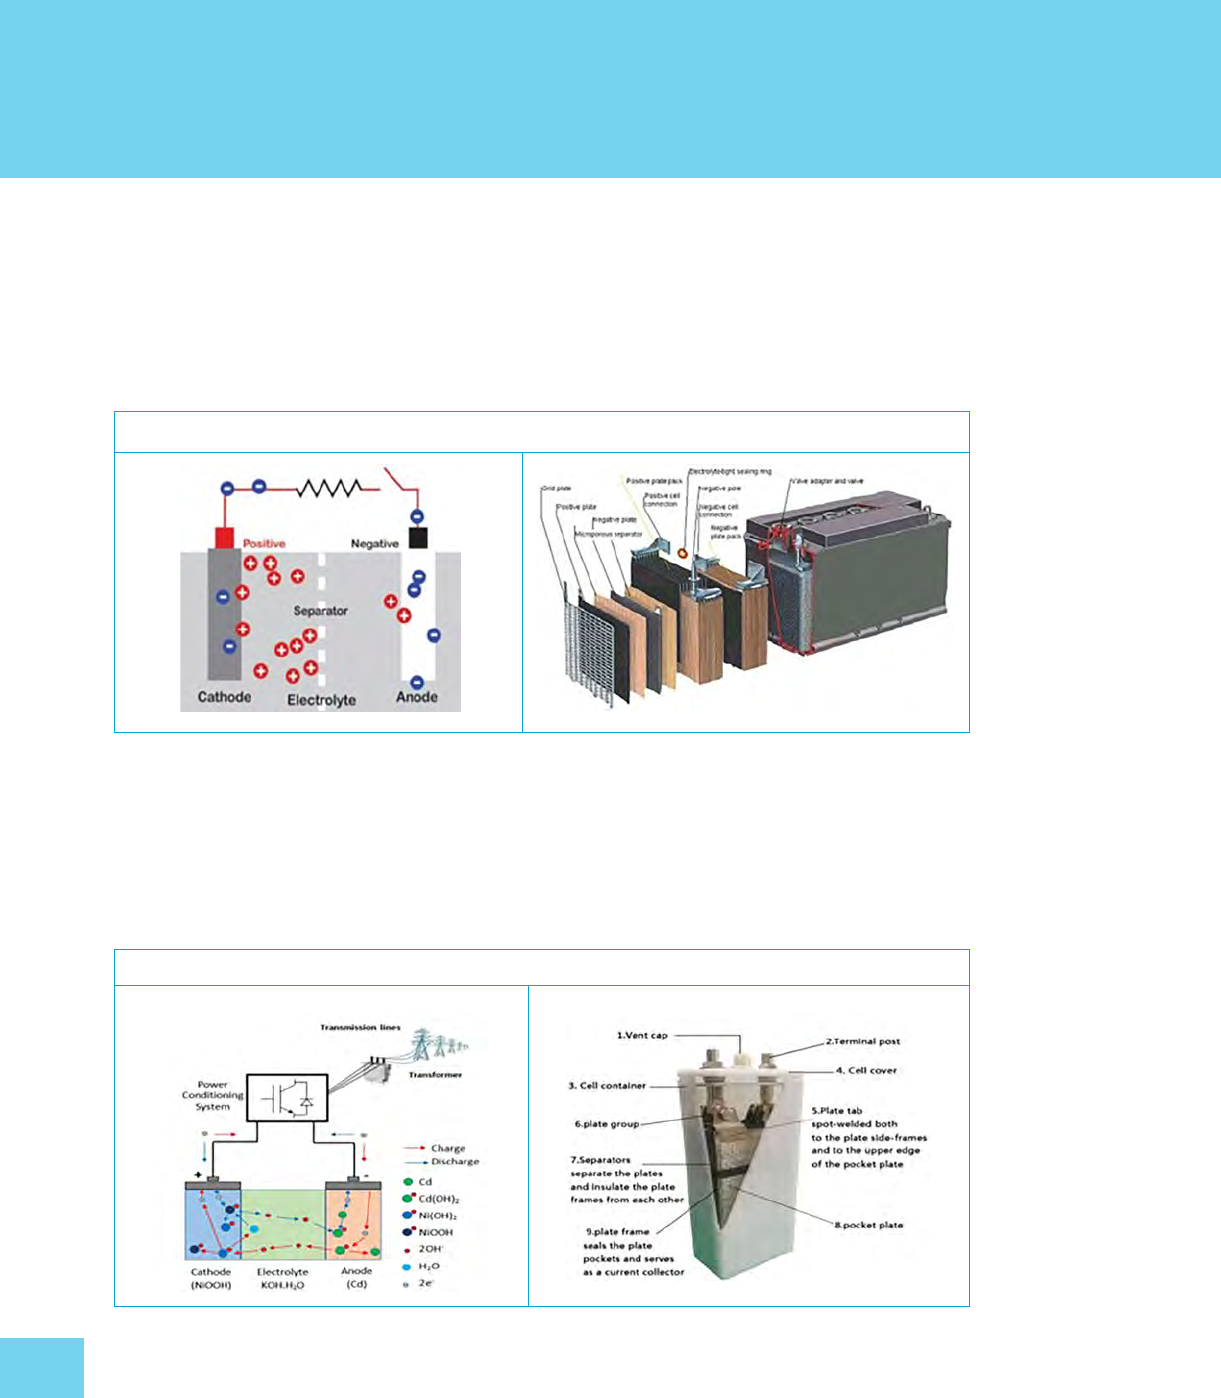
Lead–Acid (PbA) Battery
This cell is a widely applied type of secondary cell, used extensively in vehicles and other applications
requiring high values of load current. Its primary benefits are low capital costs, maturity of technology,
and ecient recycling.
Figure E.: Lead-Acid Battery Schematic and Physical Structure
Source: Korea Battery Industry Association “Energy storage system technology and business model”.
Nickel–Cadmium (Ni–Cd) Battery
A nickel–cadmium (Ni–Cd) battery is a rechargeable battery used for portable computers, drills,
camcorders, and other small battery-operated devices requiring an even power discharge.
Figure E.: Chemical and Physical Structures of Nickel-Cadmium Battery
Source: Korea Battery Industry Association “Energy storage system technology and business model”.
APPENDIX E
BATTERY CHEMISTRY
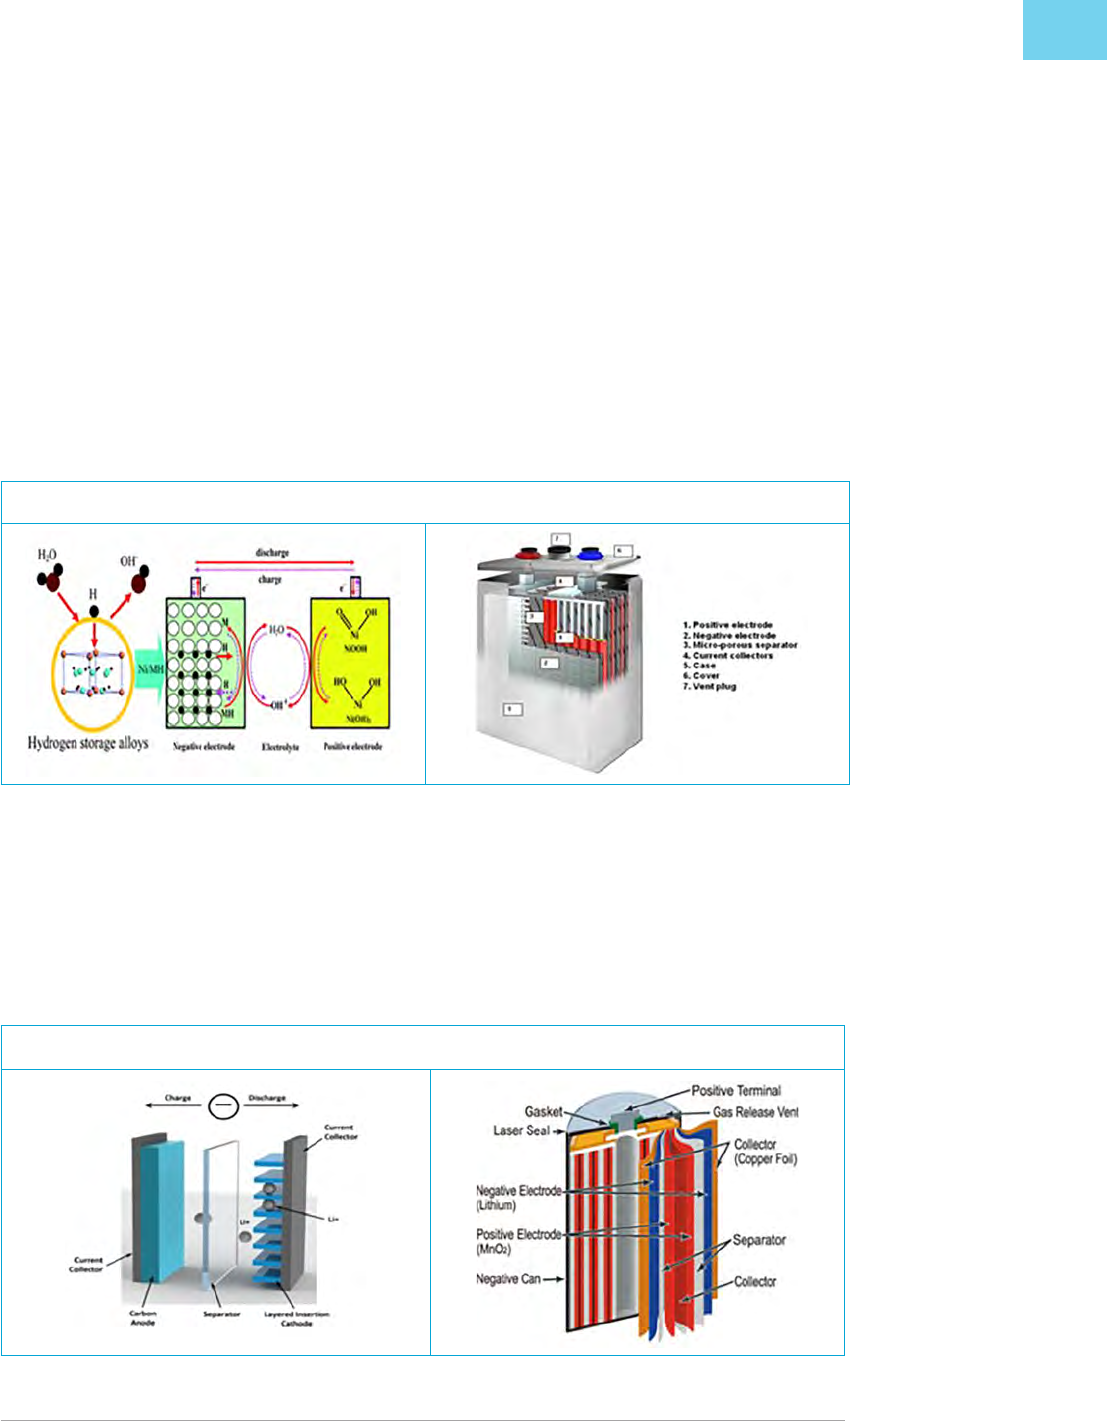
BATTERY CHEMISTRY
Nickel–Metal Hybrid (Ni–MH) Battery
The nickel–metal hydride battery chemistry is a hybrid of the proven positive electrode chemistry of
the sealed nickel–cadmium battery with the energy storage features of metal alloys developed for
advanced hydrogen energy storage concepts (Moltech Power Systems
)
Ni–MH batteries outperform other rechargeable batteries and have higher capacity and less voltage
depression.
Ni–MH batteries are currently finding widespread application in high-end portable electronic
products, where battery performance parameters, notably run time, are a major consideration in the
purchase decision.
Figure E.3: Chemical and Physical Structures of Nickel-Metal Hydride Battery
Source: Korea Battery Industry Association “Energy storage system technology and business model”.
Lithium-Ion Battery
Lithium-ion batteries have the highest energy density and are safe. No memory or scheduled cycling is
required to prolong battery life. Lithium-ion batteries are used in electronic devices such as cameras,
calculators, laptop computers, and mobile phones, and are increasingly being used for electric mobility.
Figure E.4: Physical and Chemical Structures of Lithium-Ion Battery
Source: Korea Battery Industry Association “Energy storage system technology and business model”.
Source: M. P. systems, “NiMH Technology,” . [Online]. Available: https://www.tayloredge.com/.../Batteries/Ni-MH_Generic.pdf.
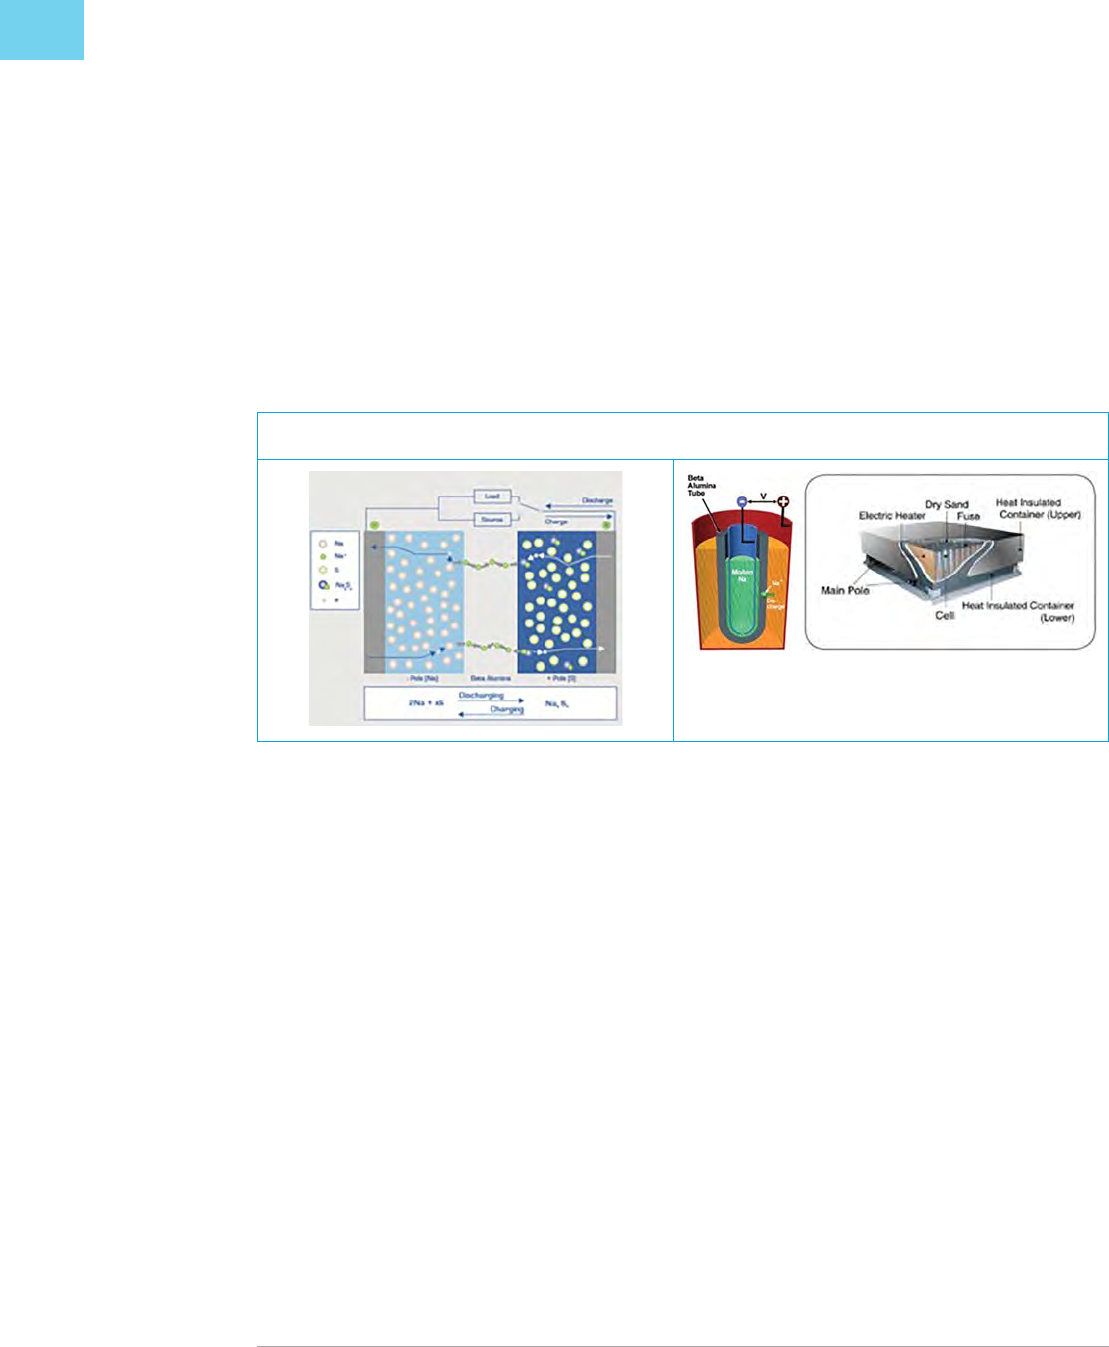
APPENDIX E
Sodium–Sulfur (Na–S) Battery
The sodium–sulfur battery, a liquid-metal battery, is a type of molten metal battery constructed from
sodium (Na) and sulfur (S). It exhibits high energy density, high eciency of charge and discharge
(–), and a long cycle life, and is fabricated from inexpensive materials.
However, because of its high operating temperatures of C–C and the highly corrosive nature
of sodium polysulfides, such cells are primarily used for large-scale nonmobile applications such as
electricity grid energy storage.
Figure E.5: Chemical and Physical Structures of Sodium-Sulfur Battery (Walawalkar 2014)
Source: D. R. Walawalkar, “Li-ion Battery Technology - IRENA,” [Online]. Available:www.irena.org/.../IRENA_walawalkar_status_
storage_final.pptx.
Advanced Thin Film Sodium Battery. China Energy Storage, en.escn.com.cn/Tools/download.ashx?id.
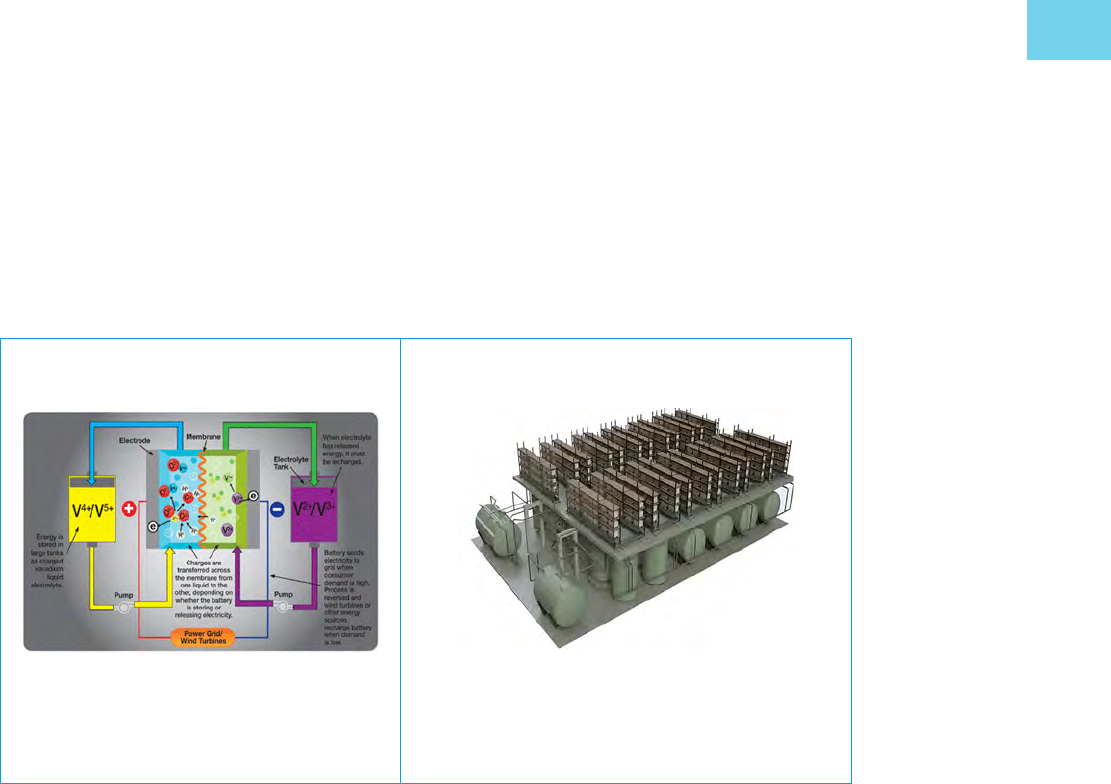
BATTERY CHEMISTRY
Redox Flow Battery (RFB)
RFBs are charged and discharged by means of the oxidation–reduction reaction of ions of vanadium or
the like. They have excellent characteristics: a long service life with almost no degradation of electrodes
and electrolytes, high safety because of their being free of combustible materials, and availability for
operation under normal temperatures.
Figure E.6: Schematic of Redox Flow
Battery (Walawalkar 2014)
Figure E.7: Physical Structure of Redox Flow
Battery (Fischer and Tuebke 2018)
Source: D. R. Walawalkar, “Li-ion Battery Technology
- IRENA,” [Online]. Available: www.irena.org/.../IRENA_
walawalkar_status_storage_final.pptx.
Source: P. D. J. T. Dr. P. Fischer, “Redox Flow Batteries for stationary
storage,” . [Online]. Available: https://www.steag.in/
sites/default/files/PaperII-RedoxFlow
Batteriesforstationarystorageapplications.ppt
BCompatibilityModeD.pdf.

ESS
Application
Required
Response Time
Reference Duty
Cycle
Energy
Discharge
Cycle Duty
ESS Unit
Power
(MW
AC
)
ESS AC
Voltage
(kV)
Full Power Discharge
Duration
Basis for
Economic
Benefits
-hour load shift minutes Scheduled -hour
discharge
d/y,
event/d
– .– hours Market
rates
-hour load
shift
minutes Scheduled -
hour discharge
d/y,
event/d
– .– hours Market
rates
Renewables time
shift
minute Optimized by
tech
According to
reference wind
profile
– .–. – hours
(except CAES; varies)
Various*
Renewables
forecast hedging
milliseconds Optimized by
tech
According to
reference wind
profile
– .–. – hours
(except CAES; varies)
Various*
Fluctuation
suppression
milliseconds Continuous
cycling
cycles/hr – .–. seconds Various*
Short-duration
power quality
milliseconds Hot standby events/y,
events/d,
event/hr
– .–. seconds Cost of
alternative
solutions
Long-duration
power quality
milliseconds Hot standby for
infrequent events
event/y – .–. hours Cost of
alternative
solutions
Frequency
excursion
suppression
milliseconds Hot standby events/y,
event/d
– .– minutes Cost of
alternative
solutions
Grid frequency
support
milliseconds events/y,
event/d
– .–. – minutes Various*
Angular stability milliseconds Hot standby events/y,
event/d,
cycles/event
– .– second Cost of
alternative
solutions
Voltage stability milliseconds Hot standby events/y,
event/d
– .– second Cost of
alternative
solutions
Transmission
curtailment
min Optimized by
tech
According to
reference wind
profile
– .–. – hours
(except CAES; varies)
Various*
AC alternating current; CAES compressed-air energy storage; d day; d/y days per year; ESS energy storage system; hr hour; kV kilovolt; min
minute; MWAC megawatt, alternating current; y year.
* Various bases for economic benefits of these applications, including capitalized costs and benefits of alternative systems, market rates, tax credits, and green
price premiums.
Source: Carnegie et al. ().
APPENDIX F
COMPARISON OF TECHNICAL
CHARACTERISTICS OF ENERGY STORAGE
SYSTEM APPLICATIONS

Metric Hydro Flywheel Lead–Acid Ni–MH Thermal Li Flow Liquid Metal
Compressed
Air
Specific energy
(kW/kg)
.–. – – – – – – – .–
Energy density
(kWh/vol)
.–. .– – .– – – .– – .–
Specific power
(W/kg)
.–. –, – –, – –, .– .– .–
Cycle life –k Indefinite –k –k Indefinite –k k k–k k–k
Useful life – – – – – –
Life cycle Near universal
life with
maintenance
Near universal
life with
maintenance
Useful life
varies by
depth of
discharge and
application,
variations by
chemistry
Allows
deeper
discharge
and more
stable
storage,
variations by
chemistry
Thermal salts
not yet proven;
passive storage
varies by
technology
Useful life
varies by depth
of discharge
and other
applications,
variations by
chemistry
Moving
parts require
intermittent
replacement
Not yet proven Near universal
life with
maintenance
Cost per kWh – –
,
–, –
,
– –, –, – –
Environmental
impact
High/Mixed Low High High/
Medium
Low High/Medium Medium Low Low/Medium
Pros Large power
capacity,
positive
externalities
Very fast
response,
high specific
power, low
cost, long life
Mature
technology
with
established
value
proposition
Deep
discharge
capacity,
reliable,
high energy
density
Could pair with
waste heat
generation,
scalable, low
cost, large scale
Flexible uses,
very fast
response and
high specific
power
Large storage
capacity, cheap
materials
High capacity,
fast response,
cheap
materials,
highly stable,
temperature
tolerant
Low cost, large
scale, mature
technology
paired with gas
turbines
Cons Geographically
limited,
expensive
construction,
low energy
density and
environmentally
damaging
Low energy
density
Low life
cycle, toxic
materials,
flammability
risk
Some toxic
variations,
less specific
power than
Li, high self-
discharge,
high
memory
eect
Not fully
commercialized
or not electrified
Safety
concerns,
low depth of
discharge,
corrosion, self-
discharge, and
eciency loss
over time
Space
requirements,
economic
eciency
in multiple
applications
Untested in
commercial
use, persistent
technology
issues
Geographically
limited, not
scalable
k thousand, kg kilogram, kWh kilowatt-hour, Li lithium, Ni–MH nickel–metal hydride, W watt.
Source: Hart, Bonvillian, and Austin ().
APPENDIX G
SUMMARY OF GRID STORAGE
TECHNOLOGY COMPARISON METRICS

Battery University. a. BU-: How Does the Lead Acid Battery Work? May. http://
batteryuniversity.com/learn/article/lead_based_batteries.
———. b. BU-: Nickel-based Batteries. May. http://batteryuniversity.com/learn/article/
nickel_based_batteries.
———. c. BU-: Types of Lithium-ion Batteries. May. http://batteryuniversity.com/learn/
article/types_of_lithium_ion.
Carnegie, Rachel, Douglas Gotham, David Nderitu, and Paul V. Preckel. . Utility Scale Energy
Storage Systems: Benefits, Applications, and Technologies. State Utility Forecasting Group, Purdue
University, Indiana, US. June.
China News Service. n.d. Advanced Thin Film Sodium Sulfur Battery. en.escn.com.cn/Tools/download.
ashx?id.
Confais, Eric, and Ward van den Berg. . Business Models in Energy Storage: Energy Storage Can
Bring Utilities Back into the Game. Roland Berger Focus. May.
Doughty, D. H., and E. Peter Roth. . A General Discussion of Li Ion Battery Safety. Electrochemical
Society Interface (): –. DOI: ./.Fif.
Electric Power Research Institute (EPRI). . Electricity Energy Storage Technology Options:
A White Paper Primer on Applications, Costs, and Benefits. Palo Alto, California, US. http://large.
stanford.edu/courses//ph/doshay/docs/EPRI.pdf
Enel Green Power. . Integrating Renewable Power Plants with Energy Storage. June.
http://www.iefe.unibocconi.it/wps/wcm/connect/be-c--da-abeb/
SlidesLanuzzagiugno.pdf?MODAJPERES&CVIDllew.
Energy and Environmental Economics, Inc. (E). . WECC Ecient Dispatch Toolkit (EDT) Phase
Energy Imbalance Market (EIM) Benefits Analysis & Results (October Revision). Prepared for the
Western Electricity Coordinating Council, Utah, US.
Fischer, P., and J. Tuebke. . Redox Flow Batteries for Stationary Storage Applications. January.
https://www.steag.in/sites/default/files/PaperII-RedoxFlowBatteriesfor
stationarystorageapplications.pptBCompatibilityModeD.pdf.
Hart, David M., William Bonvillian, and Nathaniel Austin. . Energy Storage for the Grid: Policy
Options for Sustaining Innovation. MIT Energy Initiative Working Paper Series. Massachusetts Institute of
Technology, US. April.
REFERENCES

REFERENCES
Hesse, Holger C., Michael Schimpe, Daniel Kucevic, and Andreas Jossen. . Lithium-Ion Battery
Storage for the Grid: A Review of Stationary Battery Storage System Design Tailored for Applications in
Modern Power Grids. Energies (). https://doi.org/./en.
International Renewable Energy Agency (IRENA). . Battery Storage for Renewables: Market Status
and Technology Outlook. Abu Dhabi.
———. . Electricity Storage and Renewables: Costs and Markets to 2030. Abu Dhabi.
Jim. . Used Nissan EV Batteries Now Provide Grid Scale Storage (blog). Vehicle to Grid UK May.
http://www.vg.co.uk///used-nissan-ev-batteries-now-provide-grid-scale-storage/.
Johnson, Jay, Benjamin Schenkman, Abraham Ellis, Jimmy Quiroz, and Carl Lenox. . Initial
Operating Experience of the La Ola 1.2-MW Photovoltaic System. Sandia National Laboratories Report
SAND-.
Kane, Mark. . Bosch Cooperates With BMW And Vattenfall In Second Life Battery Project. Inside
EVs February. https://insideevs.com/bosch-cooperates-with-bmw-and-vattenfall-in-second-life-
battery-project/.
———. . Renault To Enter Home Battery Market With Repurposed EV Batteries. Inside EVs
June. https://insideevs.com/renault-repurposed-ev-batteries-ess/.
McKenna, Eoghan, John Barton, and Murray Thomson. . Short-Run Impact of Electricity Storage
on CO Emissions in Power Systems with High Penetrations of Wind Power: A Case-Study of Ireland.
Journal of Power and Energy (): –. https://doi.org/./.
Microgrid Media. n.d. Microgrid Projects: Hachinohe Microgrid, Japan. Minnesota. http://
microgridprojects.com/microgrid/hachinohe-microgrid/.
Moltech Power Systems. . NiMH Technology: A Generic Overview. Florida. https://www.
tayloredge.com/reference/Batteries/Ni-MH_Generic.pdf.
Morris, Charles. . Nissan, GM and Toyota Repurpose Used EV Batteries for Stationary Storage.
Charged Electric Vehicles Magazine June. https://chargedevs.com/newswire/nissan-gm-and-toyota-
repurpose-used-ev-batteries-for-stationary-storage/.
Reid, Gerard, and Javier Julve. . Second-Life Batteries As Flexible Storage For Renewable Energy.
Report prepared for the German Renewable Energy Federation (BEE) and the Hanover Trade Fair.
April.
Sandia National Laboratories. . DOE/EPRI Electricity Storage Handbook. Prepared
in collaboration with the National Rural Electric Cooperative Association (NRECA) for the US
Department of Energy and the Electric Power Research Institute, US. New Mexico. https://prod.sandia.
gov/techlib-noauth/access-control.cgi//.pdf.
Shimizu, Yasuhiro. . Micro-grid Related Activities in Japan. New Energy and Industrial Technology
Development Organization (NEDO). September.

HANDBOOK ON BATTERY ENERGY STORAGE SYSTEM
Sumitomo Electric Industries Ltd.. n.d. Redox Flow Battery. Osaka, Japan. http://global-sei.com/
products/redox/.
Thorbergsson, Egill, Vaclav Knap, Maciej Swierczynski, Daniel Stroe, and Remus Teodorescu. .
Primary Frequency Regulation with Li-Ion Battery Based Energy Storage System: Evaluation and
Comparison of Dierent Control Strategies. Intelec 2013. th International Telecommunications
Energy Conference. Hamburg, Germany. – October.
University of Minnesota Energy Transition Lab, Strategen Consulting, and Vibrant Clean Energy. .
Modernizing Minnesota’s Grid : An Economic Analysis of Energy Storage Opportunities. Report prepared
for the Minnesota Energy Storage Strategy Workshop. July.
Walawalkar, Rahul. . Energy Storage Technology Overview. Presented at the International
Electricity Storage Policy and Regulation Workshop of the International Renewable Energy Agency
(IRENA). New Delhi, India. December.

Handbook on Battery Energy Storage System
This handbook serves as a guide to deploying battery energy storage technologies, specifically for distributed
energy resources and flexibility resources. Battery energy storage technology is the most promising, rapidly
developed technology as it provides higher eciency and ease of control. With energy transition through
decarbonization and decentralization, energy storage plays a significant role to enhance grid eciency
by alleviating volatility from demand and supply. Energy storage also contributes to the grid integration of
renewable energy and promotion of microgrid.
About the Asian Development Bank
ADB is committed to achieving a prosperous inclusive resilient and sustainable Asia and the Pacific
while sustaining its eorts to eradicate extreme poverty Established in it is owned by members—
from the region Its main instruments for helping its developing member countries are policy dialogue
loans equity investments guarantees grants and technical assistance
ASIAN DEVELOPMENT BANK
6 ADB Avenue, Mandaluyong City
1550 Metro Manila, Philippines
www.adb.org
